
Acquisition of financial assets and external financing in Germany in the second quarter of 2026 Results of the financial accounts by sector
- High valuation gains for shares and investment fund shares
- Real return remains negative for most households
- Non-financial corporations’ external financing up on the quarter
Increase in households' financial assets
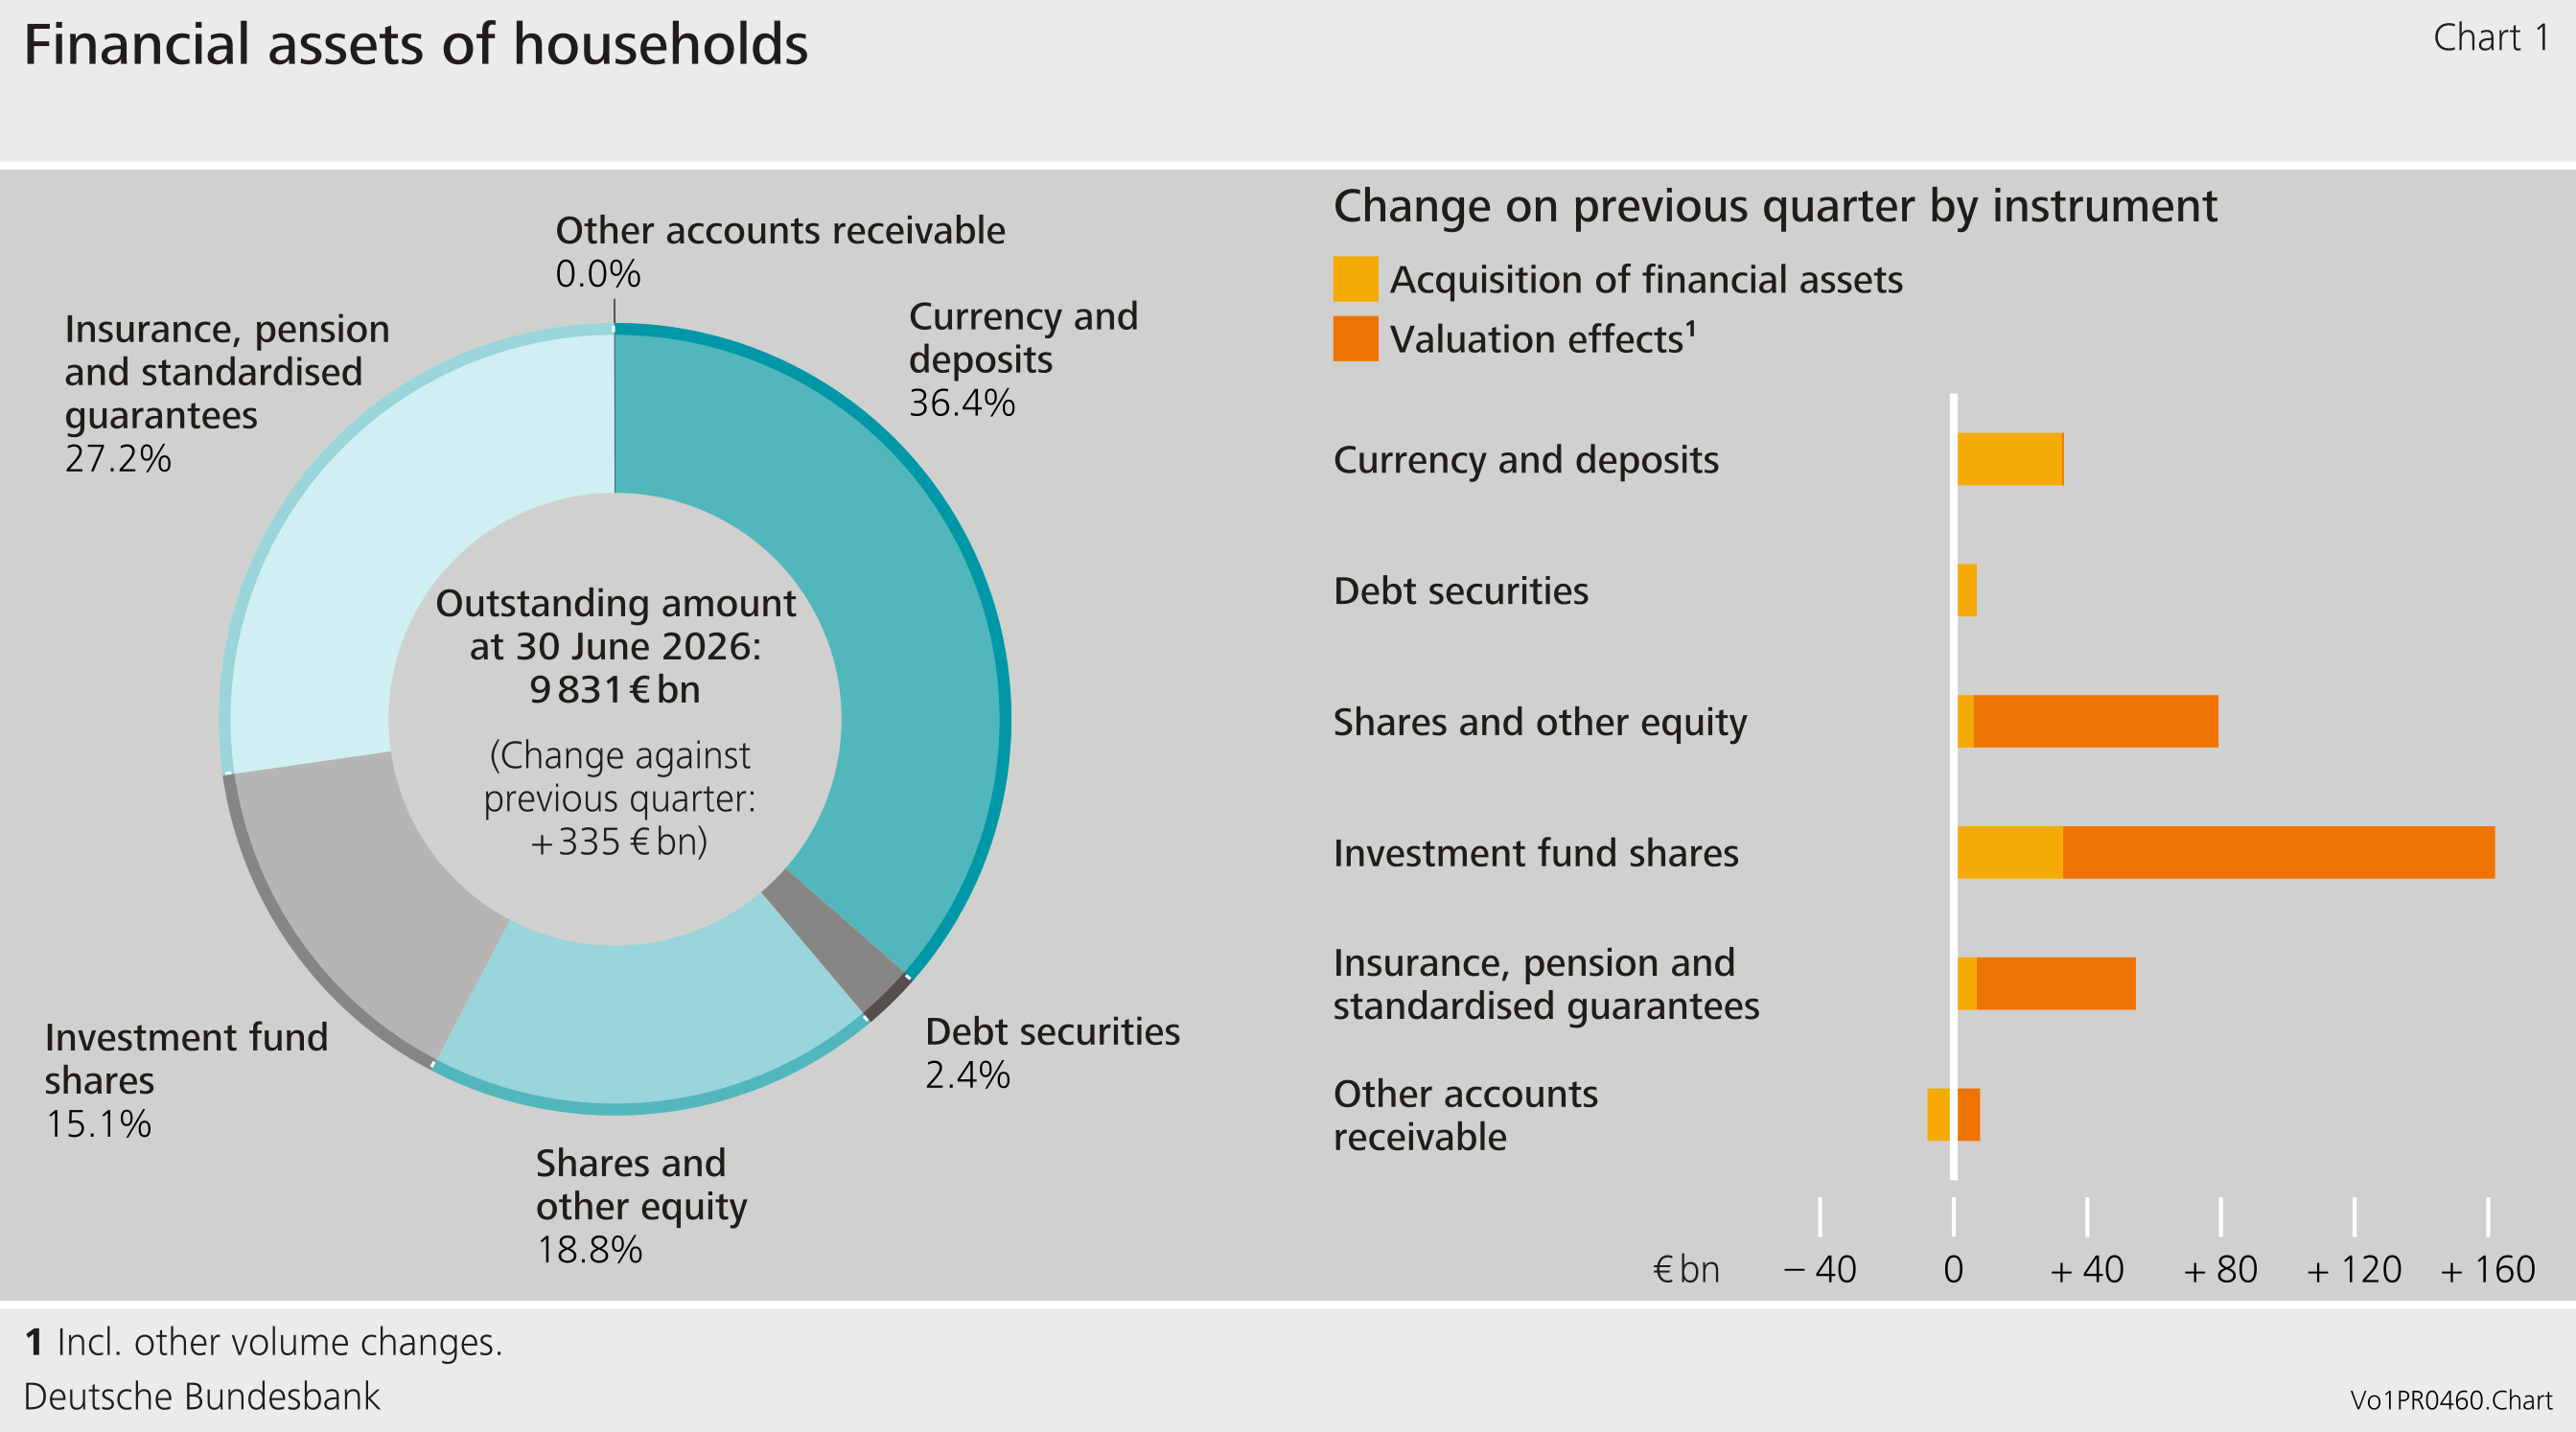
After the uncertainty in the first quarter of 2026, financial markets recovered significantly in the second quarter. This caused households’ financial assets to grow markedly. At the end of the quarter, they came to €9,831 billion, €335 billion higher than in the previous quarter. This was mainly due to exceptionally large positive valuation effects of €258 billion. Capital market-related investments accounted for most of this, with valuation gains totalling €202 billion. Insurance and pension claims recorded valuation gains of €48 billion.
The growth in financial assets was also due partly to the increase of €77 billion in financial claims, which was slightly above the average of the past five years. Around a third of this was attributable to cash and sight deposits, which had already risen repeatedly in previous quarters. Time deposits also increased, and even savings deposits and savings bonds grew, initially reversing the downward trend observed since mid-2024. Among capital market instruments, investment fund shares were in particular demand, increasing by €33 billion. Households purchased debt securities worth €7 billion on balance, a similar amount to the previous quarter. There were similar rises in shares and other equity, as well as insurance and pension claims. Insurance and pension claims thus grew much more slowly than in the previous quarter.[1]
The strong demand for investment fund shares and high valuation gains underscore the central role of capital markets in the acquisition of financial assets in Germany.
Capital market investments increase the real return on financial assets
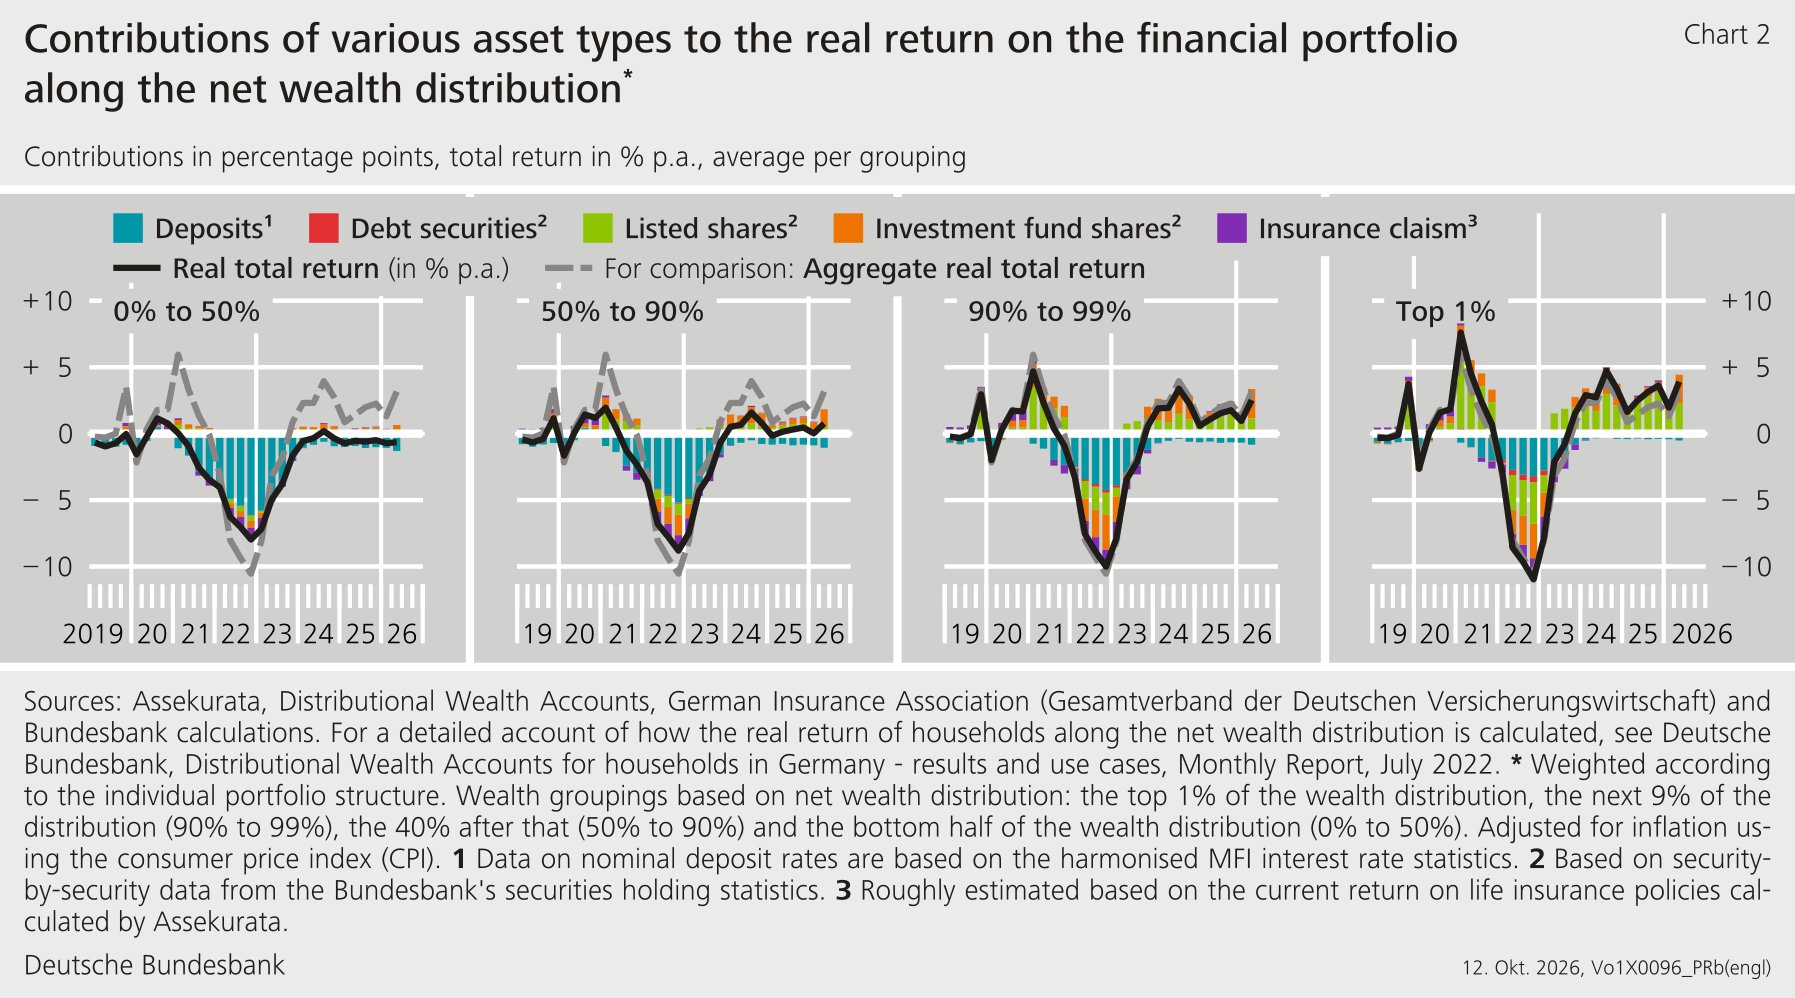
The real total return, i.e. the return adjusted for inflation, on financial assets represents the actual return on financial assets for households. Considering the individual structures of financial assets from the Distributional Wealth Accounts (DWA), Chart 2 shows the real total return on financial assets along the net wealth distribution.[2]
An analysis of wealth groups shows that the real return on financial assets rose across all groups in the second quarter of 2026.[3] The wealthiest 10 % of households, in particular, benefited from much higher positive returns on investment fund shares and shares. This is in line with the favourable developments in equity markets in the spring, which were supported by higher earnings expectations and a renewed increase in risk appetite. By contrast, despite a slight improvement, the less wealthy half of households continued to record a negative real return of around − 0.7 %. These households mainly hold their financial assets in deposits and insurance claims, whose real returns were particularly strongly affected by rising inflation. Larger contributions from capital market investments only partly offset this burden. Across all households, the aggregate real total return on the year rose to around 3.2 % in the second quarter of 2026.
Households’ external financing up slightly
Households’ liabilities grew slightly to a total of €2,192 billion in the second quarter of 2026. This increase was mainly due to €12 billion in additional borrowing, primarily from domestic banks.
Households’ debt ratio[4] fell slightly to 47.5 % owing to the rise in nominal gross domestic product. Their net financial assets increased significantly by €324 billion to €7,639 billion.
External financing of non-financial corporations recovers, long-term dynamics remain subdued
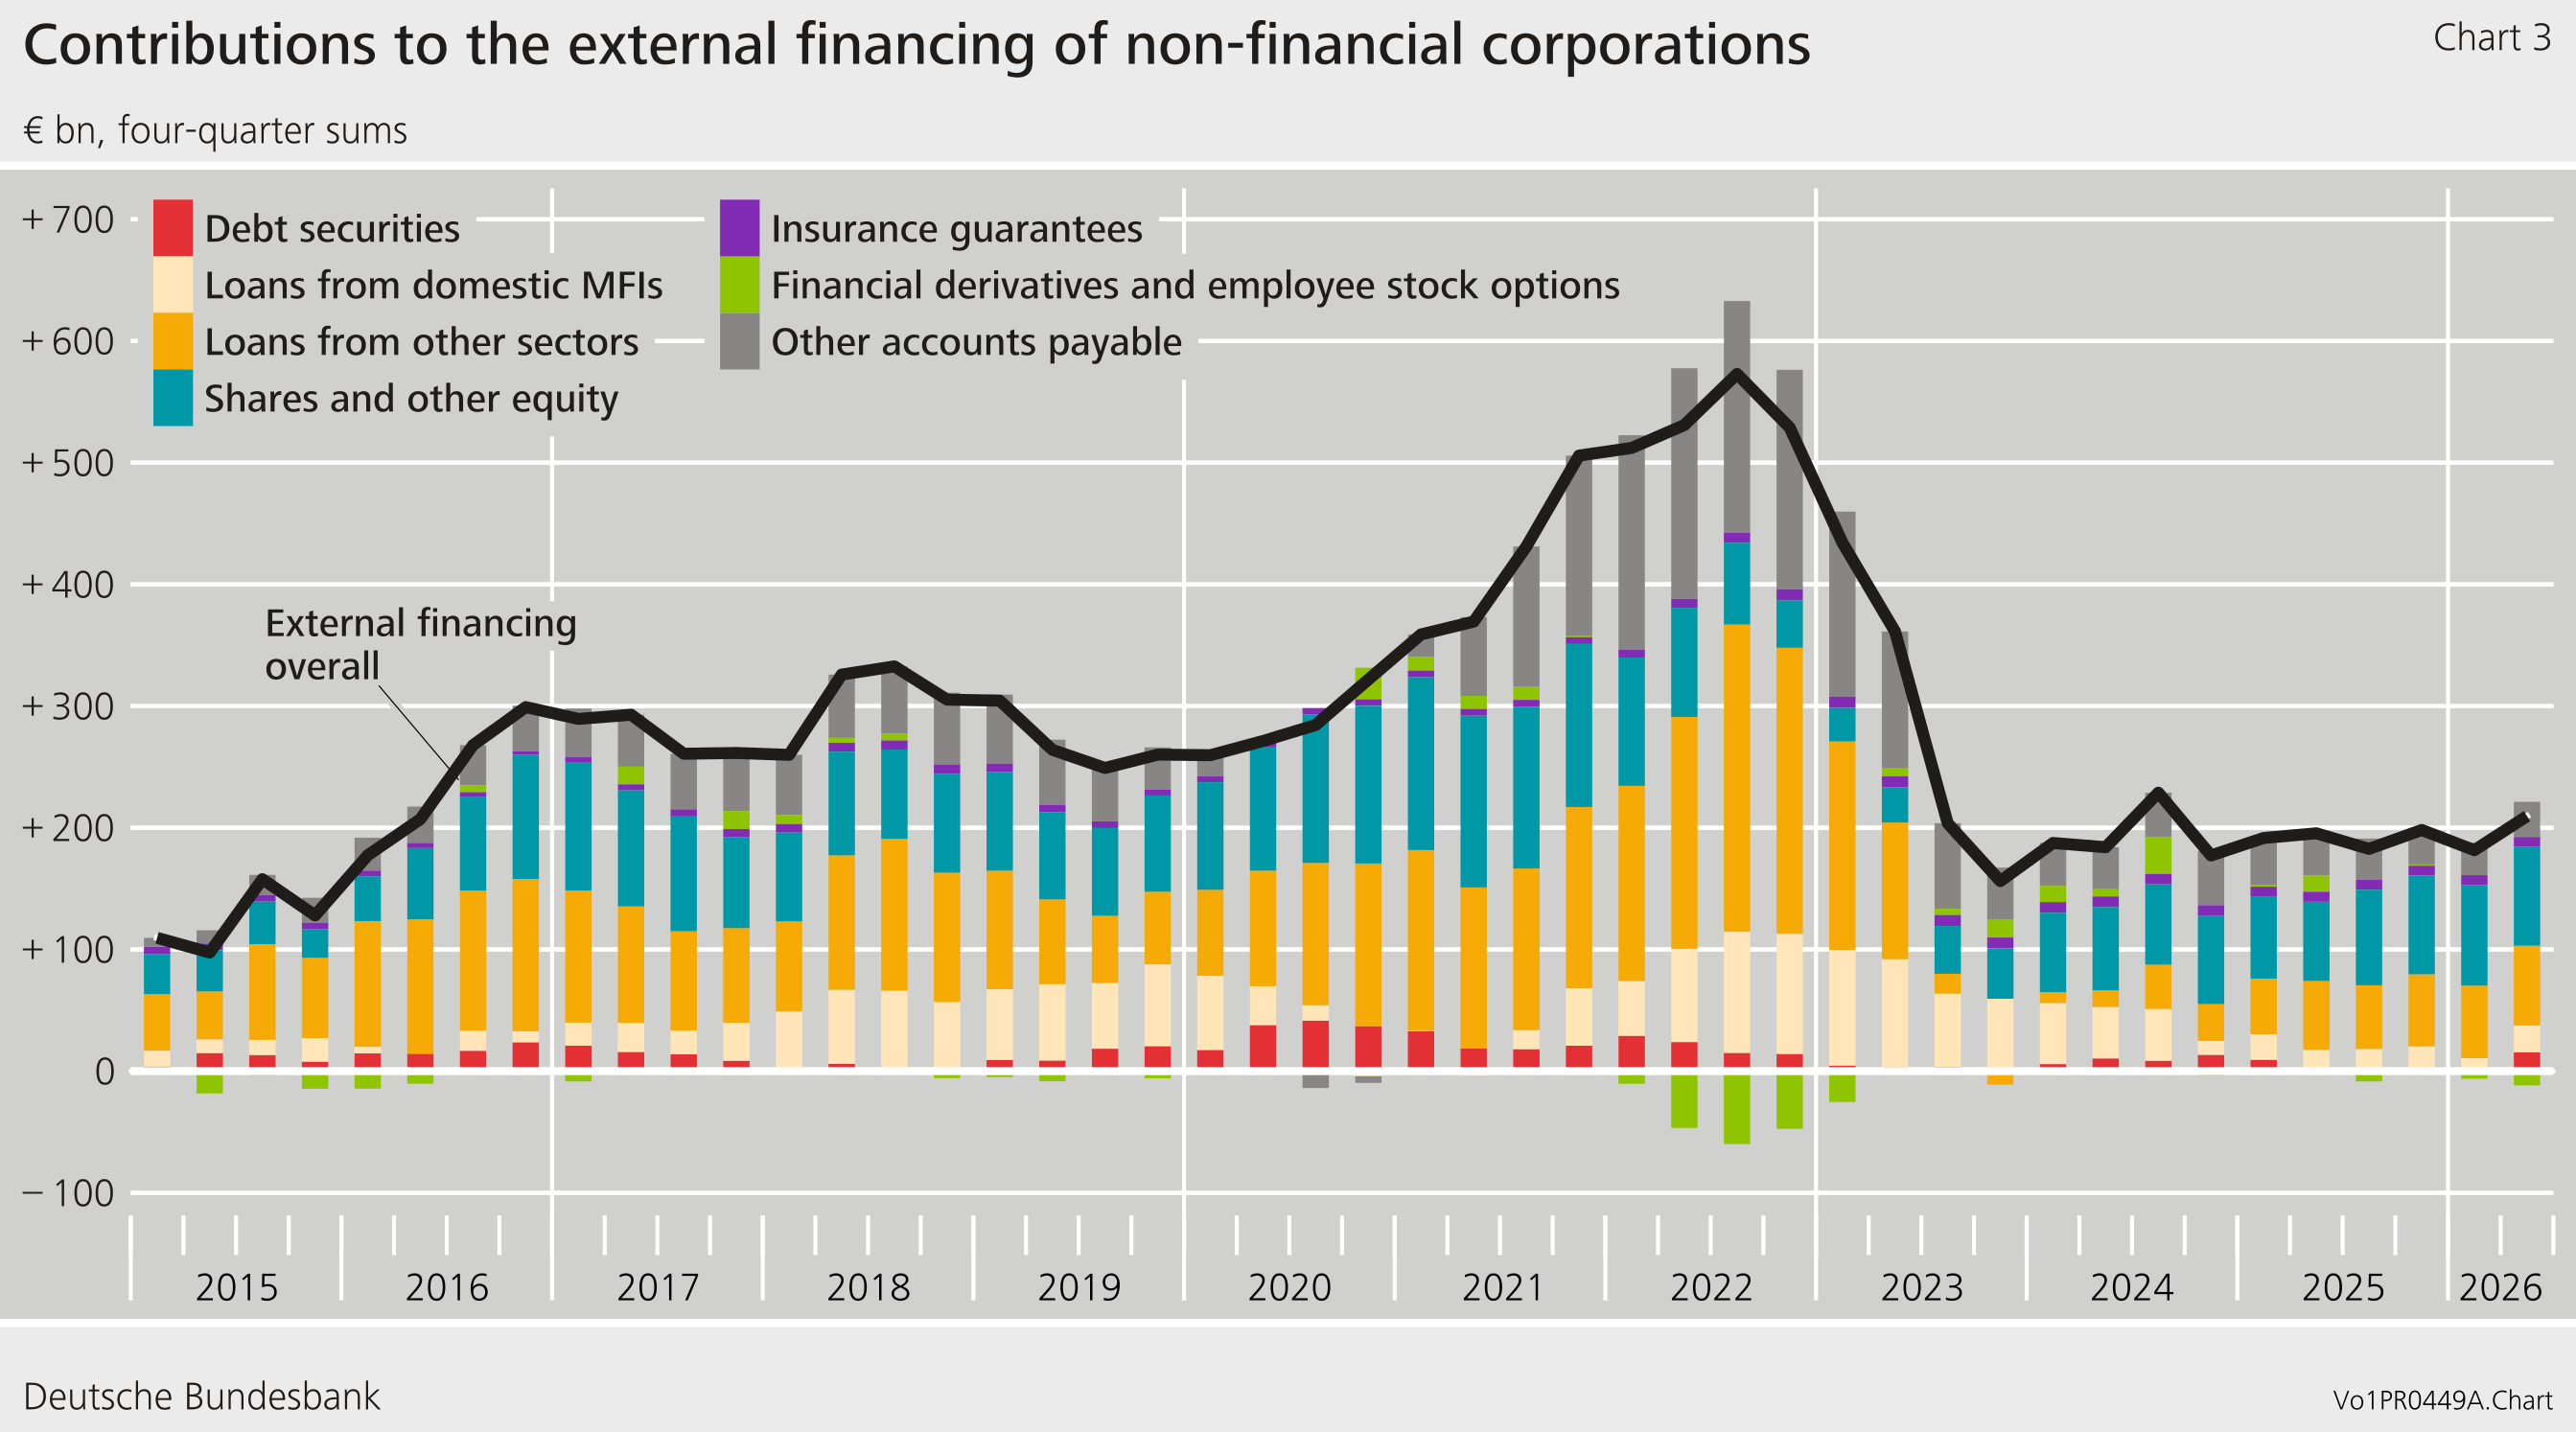
The financial market recovery in the second quarter had a substantial impact on both households’ financial assets and the financing structures of non-financial corporations in Germany. External financing increased in the second quarter of 2026 compared with the previous quarter, totalling €77 billion. This amount was due to both borrowing (€39 billion) and the significant increase in the issuance of debt securities (€14 billion). However, the issuance of shares and other equity fell compared with the previous quarter to €15 billion. On balance, even more listed shares were redeemed than new shares were issued. Accordingly, non-financial corporations did not raise any additional funds through this channel.
At the end of the second quarter of 2026, non-financial corporations’ liabilities grew by €255 billion to €12,330 billion. Positive valuation effects of €178 billion, especially for shares and other equity, played a key role in this increase. The debt ratio went up slightly to 66.8 %.
Overall, the financial assets of non-financial corporations rose by €107 billion to €9,149 billion. Due to the rise in liabilities, net financial assets fell by €148 billion on the quarter to − €3,182 billion.
Owing to interim data revisions of the financial accounts and national accounts, the figures contained in this press release are not directly comparable with those shown in earlier press releases.
Annexes: Tables
The data on the financial accounts are available at:
https://statistiken.bundesbank.de/statistiken-en/search/BBAF3.
The Bundesbank publishes a newsletter providing information about updates to the financial accounts time series. You can subscribe via the following link: Subscribe to our newsletter | Deutsche Bundesbank.
Footnotes:
- The method for calculating households’ technical provisions is based on the Solvency II reporting regime, under which the discounted cash flow method is used to calculate/value these provisions: https://eur-lex.europa.eu/legal-content/EN/TXT/PDF/?uri=CELEX:02009L0138‑20190113. The relevant interest rate term structure for discounting technical provisions in Solvency II is determined by EIOPA on a monthly basis. At each valuation date, the provisions for all existing contracts must be valued at applicable interest rates. This form of marking to market means that, under Solvency II, technical provisions are significantly influenced by the current interest rate environment. Valuation effects may therefore be stronger in certain quarters.
- The Bundesbank uses the DWA to provide additional data on the distribution of household wealth. The DWA financial portfolio comprises the following asset types: deposits, debt securities, listed shares, investment fund shares and insurance claims (life insurance and private pensions). For more information on the DWA, see also https://www.bundesbank.de/en/statistics/macroeconomic-accounting-systems/balance-sheets/balance-sheets-792952#tar-2.
- Specifically, the net wealth distribution is divided into four wealth groupings: the top 1 % of the distribution, the next 9 % of the distribution (90 % to 99 %), the following 40 % of the distribution (50 % to 90 %), and the less wealthy half of the distribution (0 % to 50 %). Net wealth is calculated as the difference between total assets (financial portfolio plus real estate and business assets) and liabilities (loans for house purchase and other debt).
- The debt ratio represents debt as a percentage of nominal gross domestic product (four-quarter moving sum).