Acquisition of financial assets and financing in Germany in 2012 Results of the financial accounts by sector
In 2012, the financial assets of households rose by just €229 billion, or 4.9%, on the previous year-end, and amounted to €4,939 billion at the end of the year.In a low interest rate environment, the trend towards more liquid investments continued throughout the year.At €72 billion, almost one-third of the increase in financial assets was due to price gains in the capital markets.Household debt rose more sharply than in previous years with an increase of €15 billion, particularly in the form of housing loans.Overall, the net financial assets of households in the period under review grew by just under €214 billion to €3,373 billion.By contrast, the net financial assets of non-financial corporations fell in comparison to 2011.This was the result primarily of considerable valuation gains, which meant in particular that the value of liabilities rose significantly– despite a transaction-related halving of external financing to €57 billion.
Households: increased acquisition of financial assets in combination with valuation gains leads to growth in financial assets; debt rises
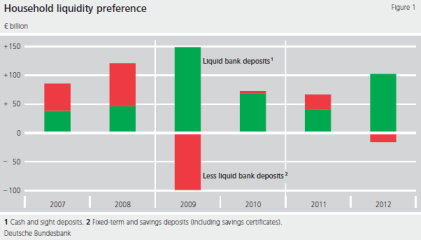
In 2012, the acquisition of financial assets by households, at almost €157 billion, was higher in nominal terms than it has been for 20 years (1993: €159 billion). A large part of this was accounted for by bank deposits (including cash holdings) at more than €86 billion; inflows in this connection exceeded the 2011 figure of just under €67 billion significantly. Sight deposits (including cash holdings) in particular recorded a considerable increase of €102.5 billion (€40 billion in the previous year). By contrast, fixed-term and savings deposits (including savings certificates) shrank by just over €16 billion overall in 2012, with a particularly sharp reduction towards the end of the year; in 2011, these deposits rose by €26.5 billion. This trend towards more liquid forms of investment, which last experienced a marked upturn in the crisis year of 2009 and thereafter declined, saw another appreciable upsurge over the course of the year. This indicates an increased preference for liquidity (Figure 1), which is likely to be attributable inter alia to the historically low interest rate environment and general uncertainty in connection with the European sovereign debt crisis.
Households' capital-market-based acquisition of financial assets was uneven in 2012. For instance, fixed-income securities (including money market paper) recorded a significant reduction on balance against the previous year (when they fell €2 billion), registering a decline of €17 billion. Direct investment in shares was also weak in 2012. Overall, shares (including other equity) totalling €0,5 billion were disposed of in the reporting period, which was the first reduction since the crisis intensified in 2008. By contrast, mutual fund shares remained constant on the whole; the main purchases were in real estate and bond funds, whilst equity funds were sold on balance. Claims on insurers rose by more than €65 billion in total, thus accounting for the largest share of financial asset acquisition besides bank deposits.
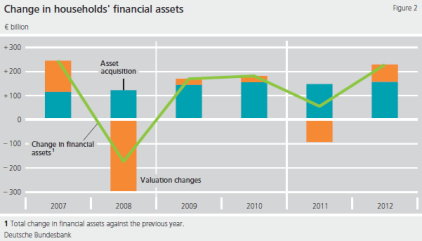
The transaction-related growth in financial assets was accompanied by considerable valuation gains on the capital markets, which amounted to €72 billion in 2012 and were due in particular to rising share prices. This meant that almost one-third of the growth in total financial assets in 2012 was attributable to valuation gains. By contrast, in 2011 price losses totalling around €92 billion had made sharp inroads into financial assets (Figure 2). Overall, these trends led to an increase in financial assets of 4.9% compared to 2011, with a total of €4,939 billion at the end of the year.
Lending to households rose markedly compared with previous years. On balance, loans (including other liabilities) of €16 billion were taken up in the historically low interest rate environment (2011: €12 billion). The share of total external financing accounted for by loans by domestic banks increased, while that of loans by non-banks (notably insurance corporations) declined. Households’ total liabilities went up by just under 1% and at the end of 2012 amounted to just over €1,566 billion (2011: €1,551 billion). Net financial assets increased in the reporting period by just under €214 billion to €3,373 billion. The debt ratio – defined as total liabilities as a percentage of annualised GDP – was down by 0.6 percentage point to 59.2%.
Non-financial corporations: slight decrease in acquisition of financial assets, external financing halved
Non-financial corporations’ acquisition of financial assets in 2012 amounted to just over €84 billion; this was slightly down on the previous year (just short of €88 billion). Asset acquisition through bank deposits (including cash holdings), at just under €19 billion, rose again. The rise was concentrated on sight deposits (including cash holdings), the increase in which by just over €57.5 billion was again markedly stronger than in the previous year (2011: €38 billion). Fixed-term and savings deposits (including savings certificates), by contrast, were reduced distinctly by just under €38.5 billion on balance. This development indicates an increased liquidity preference among enterprises, too. With purchases of securities totalling €26 billion, capital-market-based acquisition of assets was markedly lower on balance than in the previous year (2011: just under €45 billion). Declines were posted in the case of money market instruments and mutual fund shares in particular – only equities were purchased in net terms in an environment of rising share prices. At €34 billion, the inflows of funds recorded for trade credits and payments on account were lower than in the previous year.
Besides transactions, valuation gains on the capital markets of around €184 billion – including equities in particular – played a part in the increase in the financial assets of non-financial enterprises. Overall, financial assets rose by 8.7% during the reporting year and totalled just over €3,348 billion at the end of 2012.
The external financing of non-financial corporations came to around €57 billion in 2012, which was distinctly weaker than in the previous year (2011: €116 billion). Amongst other things, this was the result of a sharp decline in loans. Whereas loans totalling just under €36 billion were taken up in 2011, loans in the amount of €5 billion were repaid in 2012. Here, loans granted by domestic banks saw a particularly pronounced drop of just under €7 billion. By contrast, capital-market-based financing rose markedly, above all through the issuance of fixed-income securities (including money market paper). The volume of funds raised in this way totalled just under €19 billion; this was the highest level since 2003 (€27 billion). By contrast, equity financing of around €5 billion net fell to a level last seen at the beginning of the 1990s. As in the year before, trade credits – which in 2012 amounted to just over €32 billion – accounted for the largest share of external financing.
In addition to the no more than weak transaction-related increase, considerable price gains on the capital markets – for instance for shares – totalling €276 billion also caused non-financial enterprises’ liabilities to rise. At the end of 2012, liabilities therefore came to €4,787 billion (2011: €4,454 billion). Although external financing was halved, net financial assets were negative on the whole, amounting to just short of -€1,439 billion (2011: -€1,375 billion), due above all to the rise in liabilities caused by price gains. The debt ratio – defined as total liabilities as a percentage of annualised GDP – amounted to 66.7%, which was 0.1 percentage point down on the previous year.
Owing to data revisions, the results published in this press release are not directly comparable with data in earlier press releases.