European Banks in Challenging Times Dinner speech prepared for the Workshop "New Challenges for the Euro"
Check against delivery.
This paper has benefited from contributions by Benedikt Fritz, Johannes Gareis, Matthias Köhler, Frieder Mokinski, Anno Stolper, Benjamin Weigert and Lui-Hsian Wong.
1 Setting the stage
The global financial crisis has been a watershed for internationally active banks. The banking industry is undergoing profound structural change, reflecting technological change and adjustment to the withdrawal of (implicit) subsidies in banking sectors. Strengthening banks' capital and liquidity buffers – and thus private buffers to absorb shocks that materialize – has been a core element of the post-crisis reform agenda. Such policies are aimed at reducing the probability of failure for banks, particularly systemically important firms, and mitigating the impact of failure on the financial system and the real economy. Ultimately, a credible withdrawal of implicit guarantees for institutions deemed to be "too big to fail" requires establishing procedures for the recovery and resolution of financial institutions. Adjustment to these factors is taking place at different speeds depending on the degree of friction present and the competitive situation in the respective banking and financial sectors.
The post-crisis adjustment of banks has been shaped by the interaction of initial structural conditions, shocks, policy responses, and long-term trends in financial markets. Initially, the financial crisis hit as a major shock to liquidity on wholesale funding markets. Yet, it soon became evident that some institutions and markets were affected more structurally and that many banks were, in fact, facing solvency problems. At the macroeconomic level, several shocks interacted, leading to a decline in credit demand and supply, and evolving, in some regions, into a full-fledged sovereign debt crisis. Following the initial shock in 2008 and 2009, recovery in the period from 2010 to 2013 was asymmetric. Strong capital flows vis-à-vis emerging markets were accompanied by an increasing fragmentation of euro area banking markets (Lane and Milesi Ferretti 2017). Declining capital flows have been accompanied by a shift in the structure of capital flows away from bank lending towards equity flows and, in particular, foreign direct investment (FDI) (Bussiere, Schmidt and Valla 2016). The changing patterns of global shocks explain why it was only over time that the fault lines of certain business models of banks became visible. At the current juncture, the global banking system has built up larger capital and liquidity buffers to withstand future shocks. But low interest rates and high valuations are creating an environment conducive to risk taking and to an underassessment of risks.
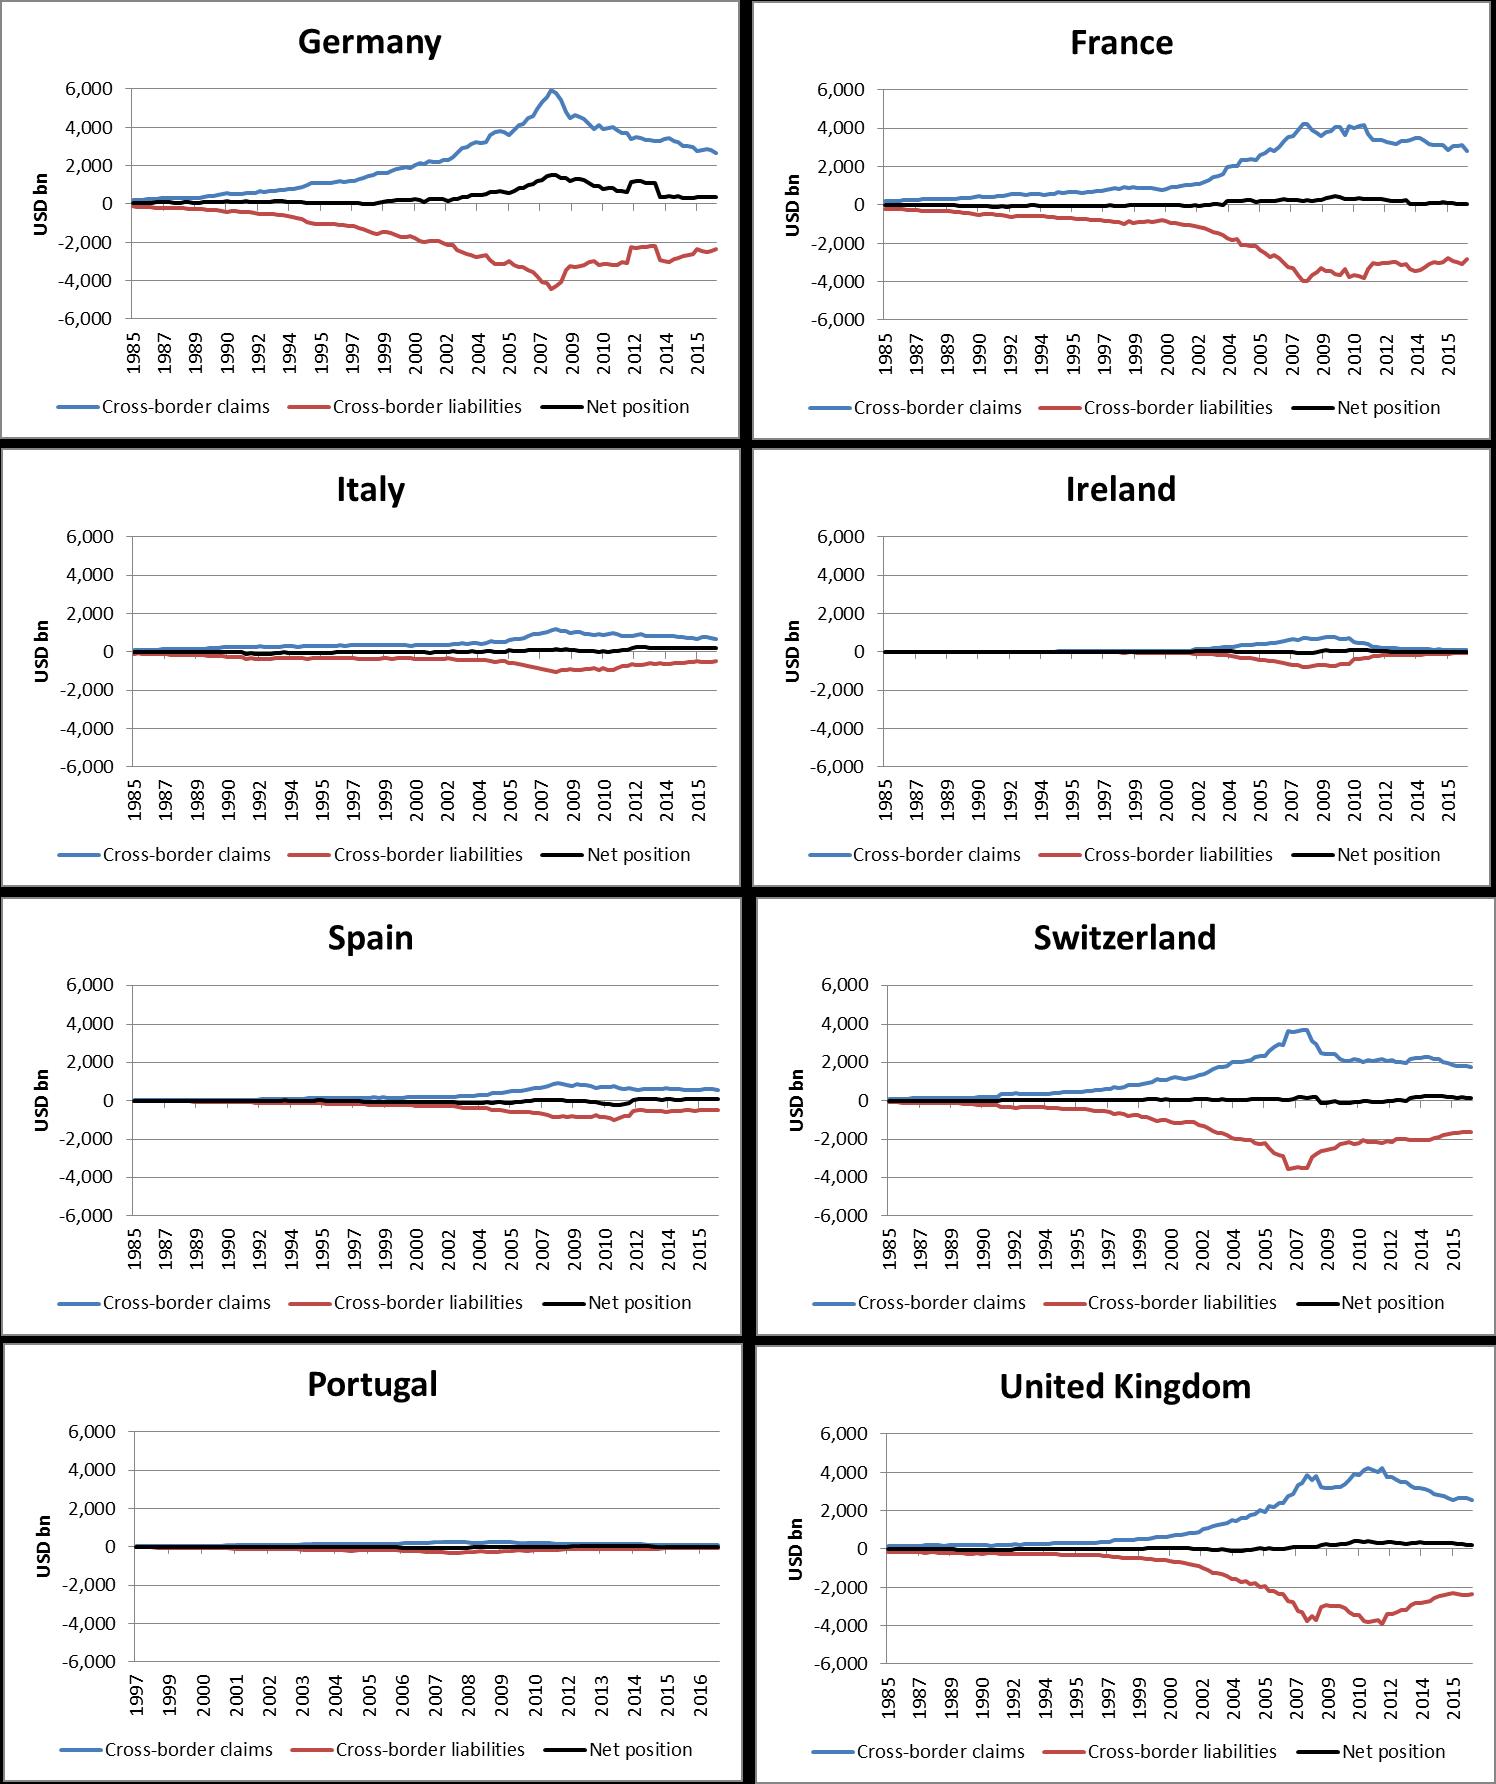
European banks have different strategies for operating in global financial markets and have thus been affected quite differently by the financial crisis. Graph 1 shows that, on average, European banks have scaled down the volume of their (gross) assets and liabilities quite significantly by about two-thirds in nominal terms. This decline has been above-average for banks from countries such as Germany and Switzerland, and below-average for banks from France or the United Kingdom. Changing patterns of bank globalization have not only affected the intensive margin but also the extensive margin: The volume of cross-border bank mergers, both within and outside the EU, has declined significantly when comparing the pre- and the post-crisis periods (ECB 2017).
These trends in global banking markets are interacting with changing patterns of integration in the real economy. Over the past decades, international trade has expanded, production has become global, and value added chains have spanned across a larger number of countries (Baldwin 2016). Longer and more complex global value added chains can have implications for the volatility of production. What is therefore needed is a better understanding of how risk-sharing and the integration of global banking markets interacts with the globalization of non-financial firms.
Different structural features of banking systems prior to the crisis had an impact on how banks adjusted to the new environment. Banking systems differ with regard to their degree of competition domestically and their exposure to international markets. Some banking systems were weakly capitalized or were weakly profitable even before the crisis. In many cases, banks in the countries concerned consolidated their international operations after the crisis. Banking systems in some countries had stronger buffers against risks prior to the crisis; banks there often seized the opportunity to expand into new markets.[1]
Policy responses after the crisis differed significantly across countries, reflecting both the need for intervention and the political support for different policy options. Some policymakers intervened early on in order to restore the financial institutions' capital; in other cases, policymakers intervened more cautiously, perhaps in the hope that the situation in which the banks found themselves would improve over time (Borio 2016). As a consequence, structural weaknesses, legacy problems, and poor returns have persisted for many banks in the post-crisis period.
Generally speaking, a distinction can be made between policy responses that were agreed upon globally and those where national discretion was exercised. Macroprudential policy has been established as an important new policy field after the crisis, and key responsibilities lie at the national level. Also, and despite international coordination and standard setting, national policy remains responsible for dealing with the recovery and resolution of banks. This degree of national discretion needs to be taken into account when assessing the effects of policies on outcomes.
Given the complexity of the issues at stake, this paper needs to be selective. I will address the following issues:
First, ten years after the crisis, I will show indicators which reveal where we stand in terms of adjustment in the real economy and the financial sector. The evidence will turn out to be mixed. Progress has been made with regard to cyclical recovery and financial sector reforms. But underlying structural issues, such as high debt levels and subdued productivity growth, remain on the agenda. At the same time, heterogeneity in adjustment across banks, markets, and countries is substantial.
Second, I will describe the channels through which the banking sector and real performance interact. Sufficient market dynamics, in both the financial sector and the real economy, are needed to promote investment and productivity growth. What is needed is an environment that encourages the private sector to undertake productive investments. Such investments are inherently risky, hence mechanisms are required to share risk while preventing excessive risk taking. The Capital Market Union can be an important project for improving private sector risk-sharing mechanisms in Europe. Concrete implications for national policies may differ, given the heterogeneity in adjustment that can be observed. Moreover, analyzing the interaction between the real and financial sector based on aggregate time trends is difficult. Understanding the effects of structural change in the real and financial sector on market dynamics, the entry and exit of firms, and sectoral reallocation as an engine for economic growth requires disaggregated data. Such data show that the weak performance of banks and of the real economy is two sides of the same coin.
Third, enhanced evidence-based policy has a vital role to play at the European level. Given limited fiscal resources, it is important to understand "what works" and what constraints actually hold back investment and growth. Good evidence is needed to assess the effects of financial sector reforms and to improve the quality of public spending for real economic development.
2 Ten years after the crisis – where do we stand?
The global financial crisis that began ten years ago had many causes. As was the case for many financial crises in history, high levels of debt which were inconsistent with real economic fundamentals were a key propagation mechanism. Recessions which have been triggered by debt-financed booms tend to be more protracted and deeper than normal recessions (Reinhard and Rogoff 2014; Schularick, Jordà and Taylor 2013).
Debt levels and the financial sector
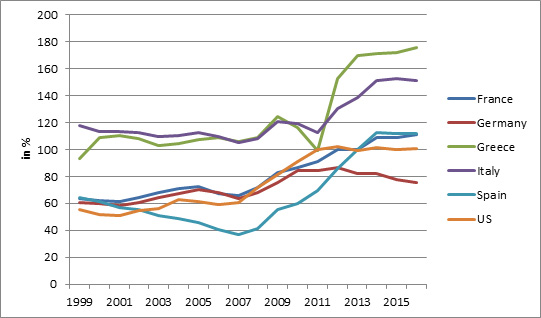
Reducing debt to sustainable levels has thus been a key goal of post-crisis financial sector reforms. Nevertheless, progress in deleveraging has been slow, and debt levels remain high. General government debt relative to GDP has increased globally (Graph 2). The rise in the share of public debt is the result of outright rescues of financial institutions, fiscal spending, and/or a decline in underlying growth dynamics. It reflects the fact that, during the crisis, risks were shifted from the private to the public sector.
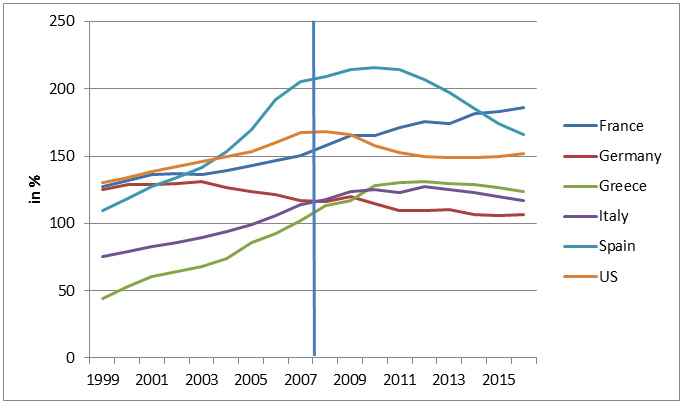
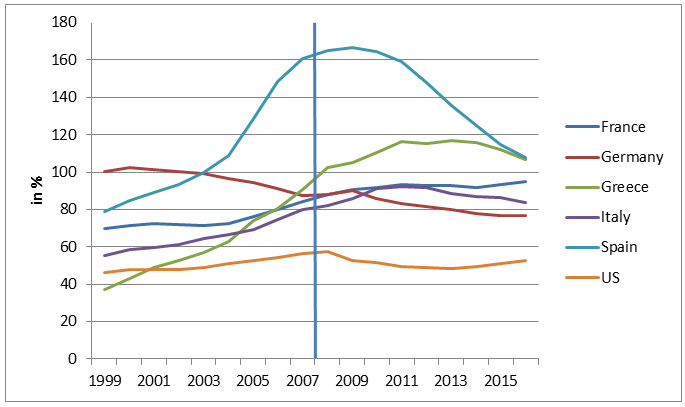
Patterns of adjustment of private sector debt have differed across countries and sectors (Graph 3). There are few countries in which there has been a significant deleveraging of the private sector. Such deleveraging trends often mirror the increase in private sector lending prior to the crisis: While lending boomed, for example, in Spain or Greece, it declined relative to GDP in Germany. To a large extent, private credit is channeled through the banking system, including loans from non-residents (Graph 4). This increase in foreign assets and liabilities reflects the increasing globalization and integration of banking markets. This allows better risk-sharing and allocation of capital across countries. But high volumes of foreign borrowing may also reduce reform incentives and lead to a misallocation of credit.[2] Moreover, the degree of cross-border risk sharing through credit markets remains limited, and the integration of bank retail markets has not progressed much in the post-crisis period (ECB 2017).
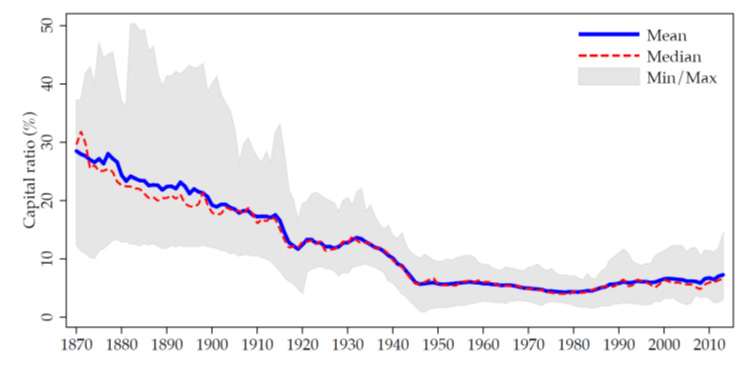
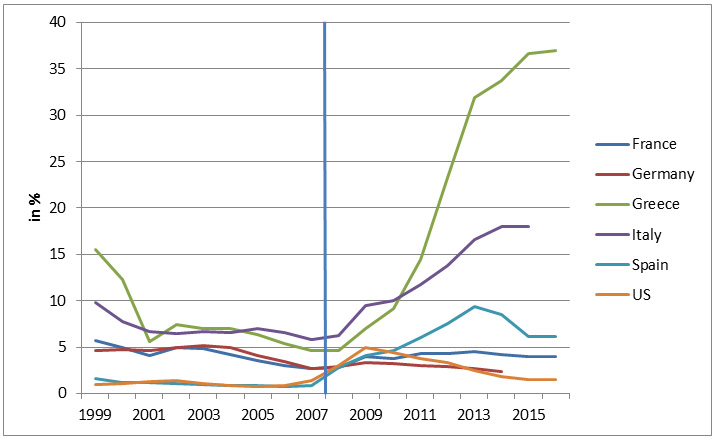
Given the importance of banks as intermediaries of private sector credit, the leverage of banks is a major factor contributing to the stability of finance. Highly leveraged financial institutions have weaker buffers against shocks and may react in a more procyclical manner. Higher capital in the financial sector does not necessarily reduce the probability of crises occurring, but it limits the real and fiscal costs of crises (Jorda, Richter, Schularick, and Taylor 2017). Graph 5 shows that the leverage of banks increased on impact during the crisis because losses materialized and wiped out part of the banks' capital buffers. Especially in countries with high rates of loan growth before the crisis, non-performing loans increased considerably after the crisis (Graph 6). Post-crisis, leverage has decreased as a result of higher capital requirements and market pressure. Yet, banks remain more highly leveraged than they have been in historical perspective.
Real sector adjustment
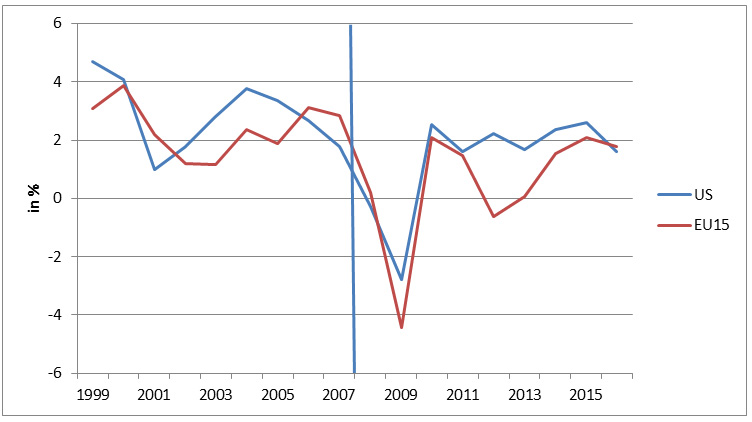
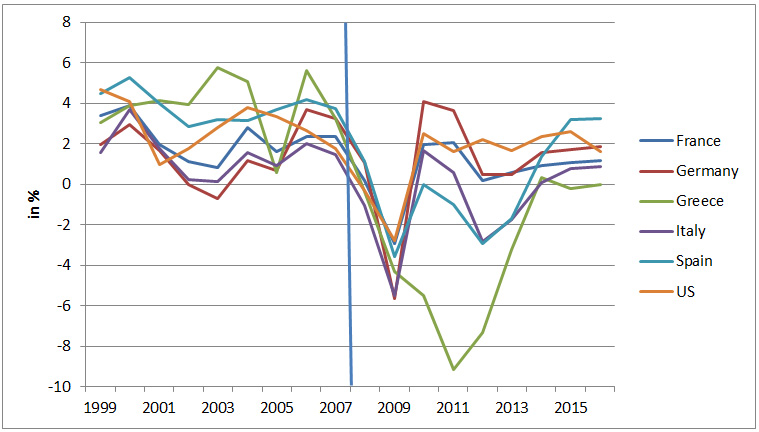
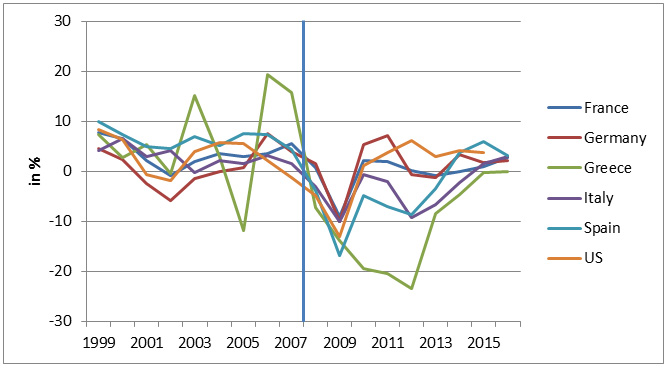
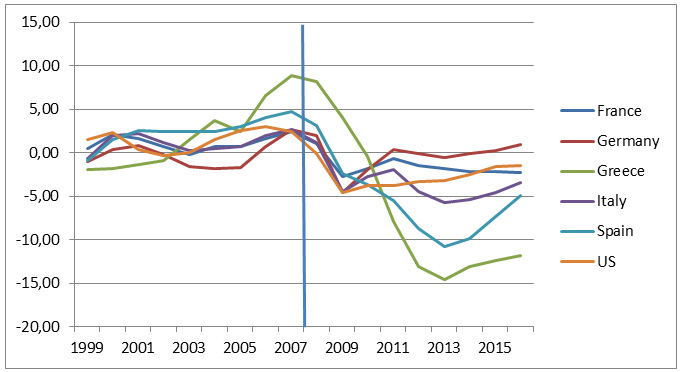
Turning to the real sector, the surge in private sector borrowing before the crisis is reflected in high levels of growth. In this sense, pre-crisis trends in growth are an insufficient benchmark for sustainable levels of growth after the crisis. During the crisis, there was a fall in real GDP growth (Graph 7 and 8), which was driven to a large extent by a decline in investment (Graph 9), and recovery has been only gradual. Comparing investment patterns in Europe and the United States, Döttling, Gutierrez, and Phillippon (2017) conclude that weak investment in the US is mainly the result of structural features of the economy and of increased concentration. In Europe, weak investment is more transitory, which is consistent with previous findings linking weak investment to debt overhang.
Heterogeneity in terms of GDP growth and output gaps in the euro area which initially increased during the crisis, has been declining (Graph 10).[3] Convergence of GDP growth implies that there is little convergence of income levels in Europe
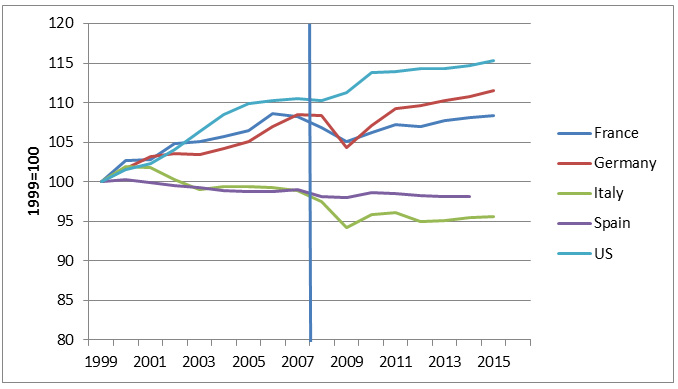
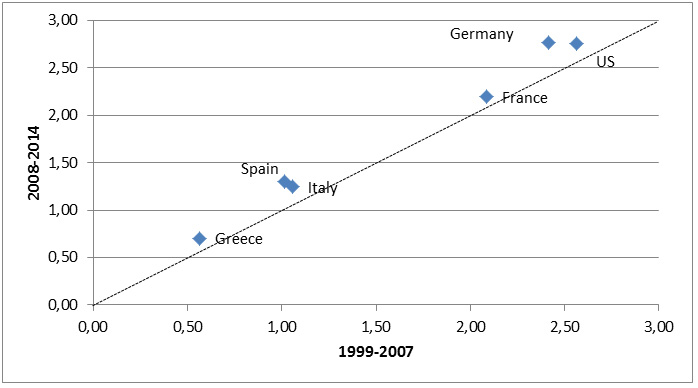
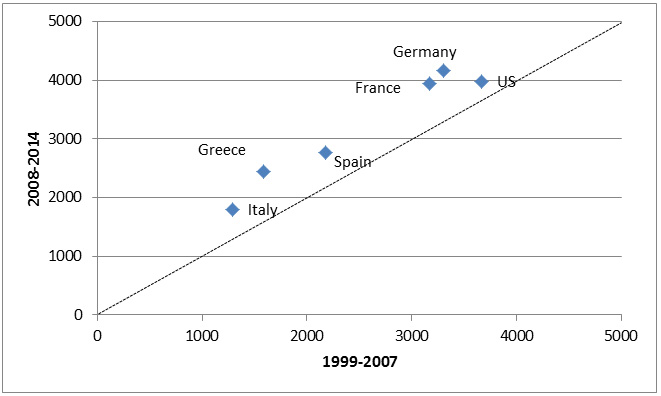
In many cases, high growth rates have not been accompanied by improvements in productivity (Graph 11). Over the past decades, productivity growth has slowed down, and the euro area lags behind the US (McGowan, Andrews, Criscuolo, and Nicoletti 2015). Differences in productivity reflect reflect differences in terms of spending on research and development (R&D) (Graph 12) and in the number of researchers employed in R&D (Graph 13). Notwithstanding differences across countries, R&D indicators have improved in the post crisis relative to the pre-crisis period.
One important driver of productivity can be the exit of weaker firms and the market entry of new, more productive firms (Cinera and Galgau 2005), which raises overall productivity. The importance of market dynamics along the extensive margin for productivity growth has been shown for the United States (Foster, Haltiwanger, and Krizan 2001) and, more recently, China (Brandt, Van Biesebroeck, and Zhang 2012). Yet, the contribution of entry and exit to productivity growth is mainly observable in high growth episodes.[4]
Structural changes in the banking sector are likewise reflected in adjustment along the extensive margin. Overall, the number of banks has been shrinking in most countries. This downward trend is also due to a decrease in number of new banks. Based on US data, Adams and Gramlich (2014) document a sharp drop in the number of new bank formation across US-counties, which they attribute mainly to weak macroeconomic conditions. The crisis has also changed the cross-border patterns of entry. Generally, banks from OECD countries have been reducing their foreign presence while banks form emerging markets have been expanding (Claessens and van Horen 2014). In general, faster growing host markets are attracting more new foreign banks.
Summing up, post-crisis trends in the real and the financial sectors provide a mixed picture. While growth has picked up, overall debt levels remain elevated. Growth remains below the – possibly inflated – pre-crisis trends, and productivity growth is weak in many regions.
3 Finance and growth: Is there a link?
Are trends in growth and finance linked and, if so, through which channels? Access to finance in general and to bank lending specifically can have positive effects on growth and productivity. Financial intermediaries provide services to the real economy by matching savers and investors, by reducing information costs, and by transforming short-term liabilities into longer-term credit. But this precise maturity transformation also makes financial institutions inherently fragile and potentially subject to runs.
Empirically, the relationship between finance and growth is ambiguous. At low or moderate levels of debt, positive growth effects dominate. As banking systems grow larger relative to the size of the real economy, negative effects on growth appear. Hence, there are non-linearities in the finance-growth relationship, and the link is insignificant in high-income countries (Barajas, Beck, Dabla-Norris and Yousefi 2013). Three factors lie behind these nonlinearities:
- Composition of credit: While there is a positive and significant relationship between enterprise credit and GDP per capita growth, empirical evidence shows an insignificant relationship between household credit and growth (Beck, Büyükkarabacak, Rioja and Valev 2012). In most high-income countries, household credit has grown persistently over the past 20 years. This might partly explain why the finance-growth nexus turns insignificant at high levels of economic development.
- Human capital: If the financial system grows (too) large relative to the real economy, it may attract more young talent towards the financial industry – with negative implications for human capital in other industries (Bolton, Santos and Scheinkman 2016; Philippon 2010). Such a drain of talent is more likely to have negative effects at high levels of financial development than in countries with emerging financial markets.
- Types of financial services: Positive growth effects are more likely if the financial sector provides value added in terms of a reduction in frictions and transaction costs. Negative effects are more likely if the financial sector engages in rent seeking and regulatory arbitrage. Empirically, these drivers of financial sector expansions are difficult to disentangle. Analyzing the contribution of the financial sector by type of services provided shows that a larger share of credit to GDP tends to increase growth and reduce volatility in the longer run (Beck, Degryse and Kneer 2014). Yet, an expansion of the financial sectors along other dimensions such as increased mortgage finance has no discernible long-run effect on real sector outcomes (Beck, Büyükkarabacak, Rioja, and Valev 2012).
Many of the factors that affect the growth-finance nexus are structural. Shocks hitting the system can aggravate their effects. The financial crisis of 2008 and 2009 has indeed had long-term negative effects on growth in OEDC countries, as captured by the loss in potential output compared with the pre-crisis benchmark (Ball 2014). The hardest-hit economies include countries which experienced banking crises such as Greece, Portugal, Ireland, or Spain; other countries, such as Australia, emerged almost unscathed. Social costs of financial crises are significant as well because unemployment increases and because macroeconomic shocks have long-run effects on economic behavior and risk-taking incentives (Malmendier and Nagel 2011).
Ultimately, empirical studies based on aggregate data cannot illuminate the channel through which the financial sector and the real economy are linked. Understanding why financial crisis are costly requires understanding growth dynamics, the sorting and selection of firms into new, profitable market segments as well as the factors driving non-viable firms out of business. In essence, understanding Schumpetarian growth dynamics is essential.
Booms and busts on markets and the associated misallocation of credit not only reflect misaligned prices that can be corrected quickly. Rather, misallocation of credit leads to the misallocation of investment, both real investment and human capital. Employees are lured into sectors and firms that do not have viable business models. Once prices correct, these investments need to be reversed, with painful adjustments required in terms of employment and skills. Flexibility of the labor markets in terms of protection of workers, not jobs, then becomes a crucial factor behind the speed and sustainability of the adjustment process.
In Europe's bank-based financial systems, the strength of the banking sector has major implications for real sector dynamics. Banks burdened with a large share of non-performing assets may "gamble" for resurrection by continuing to lend to their existing customers. This may hamper access to credit for new (productive) firms. A high degree of competitive pressure may induce banks to search for yield and to engage in excessive risk-taking. These issues might be aggravated if – implicitly or explicitly – banks benefit from public subsidies and pursue politically motivated lending strategies.
Earlier empirical evidence documents the importance of bank-firm linkages for the sectoral allocation of credit in Japan. In the 1990s, undercapitalized banks continued lending to weak Japanese firms, thus retarding recovery in the real economy (Cabellero, Hoshi, and Kashyap 2008; Peek and Rosengren 2005). More recent studies look at the size of capital injections needed to address the issue and to discourage the evergreening of loans (Gianetti and Simonov 2013).
Direct comparisons between Japan and Europe are difficult. Nevertheless, there is a growing body of evidence suggesting that issues related to evergreening and distress lending are features of European banking markets. For OECD countries, McGowan et al. (2017) show that weakly performing firms have been attracting larger resources, with negative consequences for the performance of stronger firms. Acharya, Eisert, Eufinger, and Hirsch (2017) link the pattern in the data to unconventional monetary policies. Storz, Koetter, Setzer, and Westphal (2017) focus on lending to SMEs and show that firms with negative returns on asset and net investment increased their leverage in the period from 2010 to 2014.
Using Italian data, Schivardi, Sette, and Tabellini (2017) provide evidence in support of weak banks lending to weaker firms.[5] This misallocation of credit at the firm level does not seem to be a key driver of the aggregate volume of credit. In contrast to earlier work, the authors also look at firm entry and exit. They find that distress lending slows down the exit of weak firms. This adjustment along the "extensive margin" may be a channel through which credit allocation also affects overall performance. Moreover, misallocation of credit was already observable before the onset of the financial crisis, which may have been one factor behind sluggish TFP growth in Italy in the past decade (Calligaris, Del Gatto, Hassan, Ottaviano, Schivardi 2016).
A potential misallocation of credit is, however, not confined to countries with weak growth performance and high NPLs. Storz, Koetter, Setzer, and Westphal (2017) find an increase in the leverage of weak firms in stressed economies (such as Greece, Ireland, Portugal, Slovenia, and Spain) and in non-stressed economies (such as Germany and France) alike.
4 Implications for Policy
Financial crises have large and long-lasting effects on the real economy. Just as there was no single factor which triggered the crisis and which explains its severity, there is no single explanation for the "missing" growth post crisis either. Finance certainly matters. Finance matters for the reallocation of resources across sectors and for the sorting and selection of firms that is behind Schumpetarian growth dynamics. Similar dynamics also ensure that the financial sector can perform its role efficiently. Reforming the financial sector and curing the causes of low growth can thus be two sides of the same coin.
a) Sufficient market dynamics can promote investment and growth.
For the financial sector, the key implication is that sufficient market dynamics need to be ensured. Many of the trends that affect the financial services industry such as globalization, the rate and nature technological change, and global macroeconomic developments cannot be influenced directly by national policymakers. Hence, the key question is whether the playing field provides sufficient flexibility for financial sector firms to adjust to exogenous trends, to enable structural change, and to deal with legacy issues.
Many of the post-crisis reforms have focused on these areas. Regimes for the recovery and resolution of financial institutions have been reformed; increased capital buffers allow institutions to better withstand adverse shocks; there has been an improvement in systems for surveillance of risks in the banking and in the non-bank sectors. These reforms contribute to the resilience of the financial sector and mitigate negative contagion effects. Moreover, policies for dealing with non-performing loans facilitate an improved allocation of resources. Insolvency regulation plays an important role in this regard, as does the functioning of the secondary market for assets. But, ultimately, resolving the issue of non-performing loans cannot be seen in isolation from an adequate capitalization of banks.
In striking a balance between risk-taking by entrepreneurs in the real economy and financial stability, equity finance plays a key role. In contrast to debt contracts, equity contracts feature "automatic" risk-sharing mechanisms: investors benefit from positive, upside risks but they can also lose their investments if a negative shock hits. In Europe, equity markets in general and venture capital markets in particular remain underdeveloped. Opportunities for cross-border risk-sharing are insufficiently exploited.
As regards incentives for investment and risk-sharing, the Capital Markets Union is a project which provides a major opportunity. It can help to alleviate constraints on the cross-border movement of (equity) capital; it can allow for more market-based risk-sharing in Europe, and can help to alleviate constraints that currently hamper reallocation in the real and financial sectors and prevent growth dynamics from being set into motion.
b) Structured policy evaluations are needed to assess the effects of post-crisis financial sector reforms.
After the crisis, several major reform initiatives for the financial sector were launched. So far, national and international bodies have focused on the monitoring of the implementation of these reforms (FSB 2016). Answering the question of how financial sector reforms have affected market dynamics and the real economy requires going a step further. It requires a framework for the evaluation of reform effects, which makes it possible to attribute observed trends in banking systems and financial markets to reforms, while taking account of differences in adjustment across banks, countries, and over time.
One crucial objective of policy evaluation is the distinction between effects of reforms on individual firms and effects on the financial system. (Short-term) costs of reforms for the private sector such as costs of compliance are often more visible and easier to measure than longer-terms benefits for society as a whole. Some of these benefits arise through shifts in costs from the public to the private sector: withdrawing implicit public guarantees for financial institutions increases the costs of debt because creditors cannot rely on bailouts and thus demand higher risk premia. This will show up as a private cost. Yet, society as a whole benefits if the financial system becomes more stable and if risk is not shifted to the public sector.
The Financial Stability Board (FSB) has recently developed a framework which will form the basis of internationally coordinated efforts aimed at assessing reform effects (FSB 2017). At their summit in July 2017, G20 Leaders expressed their support for this framework for the post-implementation evaluation of the effects of the G20 financial regulatory reforms (G20 2017). This framework will guide ex-post evaluation work by the FSB and international standard setting bodies. The purpose of such evaluation work is to ascertain whether the G20 financial regulatory reforms are achieving their intended outcomes, and to help detect any material unintended consequences that may have to be addressed, without compromising on the resilience objectives of the reforms. Among other things, the framework identifies methods that are useful for policy evaluation and discusses how well such methods address the challenges inherent in such analyses. The framework also specifies processes to be followed in evaluation work.
To see why structured policy evaluation is needed, take the effects of increased capital requirements which are a key element of the post-crisis reform agenda. Better capitalized banks are more resilient and can lend more to the real economy. At the same time, post-reform trends in bank lending have differed across countries, banks, and industries. This raises a number of questions: Has lending declined because of weaker credit demand? Are banks lending more prudently? What has been the impact of regulations on stability and growth? Does bank lending support sectoral reallocation – and thus growth? And what has been the effect of increased non-bank competition? Aggregate time trends in lending do not answer these questions – and do not provide a good basis for policy decisions. Rather, the detailed data across jurisdictions and the empirical methods for (causal) identification that are available can lay the basis for more informed policy decisions.
c) Better evidence is also needed in order to promote growth-friendly policies.
The need for good policy evaluation goes beyond the financial sector. In order to enhance growth and productivity, incentives for investment and risk sharing are needed. Binding constraints for investment and productivity growth need to be identified. Are funding constraints, the lack of skilled personnel, or bottlenecks in the public infrastructure major impediments for investment? What types of investments promise the biggest returns? Answers to these questions have major implications for economic policy. Without good answers, providing additional (public) funding might not alleviate the most binding constraints and even lead to a misallocation of resources.
Enhancing evidence-based policy making in Europe, learning from best practice, and establishing guidelines for good policy evaluations is a European project which promises high returns. Policy evaluation is key, in particular during times of strained public finances. Instead of emphasizing the volume of spending, focus should also be on the quality of spending. The European Commission has a tradition of promoting evidence-based policy making. Strengthening this approach and focusing on "what works" could be an important step forward for Europe.
In Europe, there are several initiatives for promoting evidence-based policymaking. The European Commission has formulated "Better Regulation Guidelines" which set out key principles for evaluations with a requirement for qualitative, and where possible, quantitative assessments of regulations and policy measures taken.[6]
Strengthening evidence-based policy-making at the European level can also build upon and strengthen existing national initiatives. In the Netherlands, the Bureau for Economic Policy Analysis (CPB) is an independent part of the ministry of economic affairs, which regularly analyses the costs and benefits of policy initiatives. In Germany, the National Regulatory Control Council (Normenkontrollrat) is tasked with the quantification of the administrative costs of regulatory initiatives. It was founded as part of a government program to reduce the costs of bureaucracy and to improve legislation (Bundesregierung 2006). This council recently proposed expanding the scope of its analyses as well as taking into account total economic costs and second-round effects (such as effects on competition, employment or R&D) (NKR 2015).
Better policy evaluations can have major benefits for the private and the public sector. For the public sector, providing cost-benefit analyses and causal impact assessments is part of accountability to the general public. For the private sector, policy evaluation can be beneficial because it helps to focus policy initiatives on the relevant constraints and the role that policy has in alleviating such constraints. This helps to focus attention on relevant policy issues and in striking a better balance between the roles of the state and the private sector. Policy evaluation does not change responsibilities for policy decisions and implementation. Rather, the European level has an important role to play in terms of providing guidelines for policy evaluation, coordinating evaluations across countries, and providing access to information on evaluation results.
Graph 1: Cross-border claims and liabilities by country
Graph 1 shows the development of cross-border claims and liabilities by nationality of reporting bank. Data are taken from the Locational Banking Statistics of the BIS.
Graph 2: Public debt (% of GDP)
Graph 2 shows the development of general government debt to GDP (as a percentage). Public sector comprises central, state and local governments, and social security funds (without public enterprises). Debt is obtained as the sum of the following liability categories (as applicable): currency and deposits, loans, and debt securities. Vertical line separates the pre-crisis period (up to 2007) from the crisis period (as of 2008).
Graph 3: Private sector debt (% of GDP)
Graph 3 shows the development of private sector debt to GDP (as a percentage). Private sector comprises non-financial corporations (both private-owned and public-owned), households and non-profit institutions serving households. Vertical line separates the pre-crisis period (up to 2007) from the crisis period (as of 2008).
Graph 4: Private credit granted by deposit money banks (% of GDP)
Graph 4 shows the development of private credit provided by deposit money banks to GDP (as a percentage). Deposit money banks comprise commercial banks and other financial institutions that accept transferable deposits, such as demand deposits. Vertical line separates the pre-crisis period (up to 2007) from the crisis period (as of 2008)
Graph 5: Bank capital in historic perspective (% of total assets)
Figure 1 from Jordá, Richter, Schularick, and Taylor (2017: p. 8) shows the capital ratio, averages by year for 17 countries. The blue line plots the mean of capital ratios in the sample countries between 1870 and 2013. The red line refers to the median of the sample countries. The grey area is the min-max range for the 17 countries in our sample. Details are given in the original paper.
Graph 6: Bank nonperforming loans (% of total loans)
Graph 6 shows the development of non-performing loans to gross loans (the total value of the loan portfolio including nonperforming loans before the deduction of specific loan-loss provisions). Vertical line separates the pre-crisis period (up to 2007) from the crisis period (as of 2008).
Graph 7: Gross domestic product (annual growth rate)
Graph 7 shows the development of the growth rate of the gross domestic product in the US and the EU15. The EU15 comprises the following 15 countries: Austria, Belgium, Denmark, Finland, France, Germany, Greece, Ireland, Italy, Luxembourg, Netherlands, Portugal, Spain, Sweden, United Kingdom. Vertical line separates the pre-crisis period (up to 2007) from the crisis period (as of 2008).
Graph 8: Gross domestic product (annual growth rate)
Graph 8 shows the development of the growth rate of the gross domestic product in the US and selected European countries. Vertical line separates the pre-crisis period (up to 2007) from the crisis period (as of 2008).
Graph 9: Gross fixed capital formation (annual growth rate)
Graph 9 shows the development of the growth rate of capital formation. Gross fixed capital formation (GFCF) is defined as the acquisition (including purchases of new or second-hand assets) and creation of assets by producers for their own use, minus disposals of produced fixed assets. The relevant assets relate to products that are intended for use in the production of other goods and services for a period of more than one year. Vertical line separates the pre-crisis period (up to 2007) from the crisis period (as of 2008).
Graph 10: Output gap (% of potential GDP)
Graph 10 shows the development of the output gap of the total economy. The output gap is measured as deviation of actual GDP from potential GDP as a percentage of potential GDP. Vertical line separates the pre-crisis period (up to 2007) from the crisis period (as of 2008).
Graph 11: Productivity (1999 = 100)
Graph 11 shows the development of multifactor productivity (MFP). MFP reflects the overall efficiency with which labour and capital inputs are used together in the production process. Changes in MFP reflect the effects of changes in management practices, brand names, organizational change, general knowledge, network effects, spillovers from production factors, adjustment costs, economies of scale, the effects of imperfect competition and measurement errors. Growth in MFP is measured as a residual, i.e. that part of GDP growth that cannot be explained by changes in labour and capital inputs. In simple terms, therefore, if labour and capital inputs remained unchanged between two periods, any changes in output would reflect changes in MFP. This indicator is measured as an index and in annual growth rates. No data available for Greece and 2016. Vertical line separates the pre-crisis period (up to 2007) from the crisis period (as of 2008).
Graph 12: Research and development expenditure (% of GDP)
Graph 12 plots the average R&D expenditures (% of GDP) in the pre-crisis (1999-2007) against the average R&D expenditures in the crisis period (2008-2014). No data available for 2015 and 2016. Expenditures for research and development are current and capital expenditures (both public and private) on creative work undertaken systematically to increase knowledge, including knowledge of humanity, culture, and society, and the use of knowledge for new applications. R&D covers basic research, applied research, and experimental development.
Graph 13: Researchers in R&D (per million persons)
Graph 13 plots the average number of researchers in R&D (per million persons) in the pre-crisis (1999-2007) against the number of researchers in R&D in the crisis period (2008-2014). No data available for 2015 and 2016. Researchers in R&D are professionals engaged in the conception or creation of new knowledge, products, processes, methods, or systems and in the management of the projects concerned.
5 References
- Acharya, Viral V., Tim Eisert, Christian Eufinger, and Christian W Hirsch (2017). Whatever it takes: The real effects of unconventional monetary policy. SAFE Working Paper, No. 152. Frankfurt a.M.
- Adams, Robert M. and Jacob Gramlich (2014). Where Are All The New Banks? The Role of Regulatory Burden in New Bank Formation. Federal Reserve Board Finance and Economics Discussion Series 2014-113.
- Albertazzi, Ugo, and Domenico Junior Marchetti (2010). Credit supply, flight to quality and evergreening: an analysis of bank-firm relationships after Lehman. Bank of Italy, Temi di Discussione 756. Rome.
- Asturias, Jose, Sewon Hur, Timothy J. Kehoe, and Kim J. Ruhl (2017). Firm Entry and Exit and Aggregate Growth. NBER Working Paper 23202. Cambridge MA.
- Baldwin, Richard (2016). The Great Convergence: Information Technology and the New Globalization. Harvard University Press. Cambridge MA.
- Ball, Laurence M.(2014). Long-term damage from the Great Recession in OECD countries. European Journal of Economics and Economic Policies: Intervention 11 (2): 149–160.
- Barajas, Adolfo, Thorsten Beck, Era Dabla-Norris, and Seyed Reza Yousefi(2013). Too Cold, Too Hot, Or Just Right? Assessing Financial Sector Development Across the Globe. IMF Working Paper 81. Washington DC.
- Beck, Thorsten, Berrak Büyükkarabacak, Felix Rioja, and Neven T. Valev (2012). Who Gets the Credit? And Does It Matter? Household vs. Firm Lending Across Countries. The B.E. Journal of Macroeconomics 2(1): 1-46.
- Beck, Thorsten, Hans Degryse, and Christiane Kneer (2014). Is more finance better? Disentangling intermediation and size effects of financial systems. Journal of Financial Stability 10: 50-64.
- Bolton, Patrick, Tano Santos, and Jose Scheinkman (2016). Cream-Skimming in Financial Markets. Journal of Finance 71: 709–736.
- Borio, Claudio (2016). The banking industry: struggling to move on, Keynote speech at "Competition in banking: implications for financial regulation and supervision", Fifth EBA Research Workshop, London, 28-29 November.
- Brandt, Loren, Johannes Van Biesebroeck, and Yifan Zhang (2012). Creative accounting or creative destruction? Firm-level productivity growth in Chinese manufacturing. Journal of Development Economics 97(2): 339-351.
- Buch, Claudia, Matthieu Bussière, and Linda Goldberg (2016). Prudential policies crossing borders: Evidence from the International Banking Research Network. VOX, CEPR's Policy Portal 9. London.
- Bundesregierung (2006). Programm Bürokratieabbau und bessere Rechtsetzung. Berlin.
- Bussière, Matthieu, Julia Schmidt and Natacha Valla (2016). International Financial Flows in the New Normal: Key Patterns (and Why We Should Care). CEPII Policy Brief 2016:10. CEPII research center. Paris.
- Caballero, Ricardo J., Takeo Hoshi, and Anil K. Kashyap (2008). Zombie Lending and Depressed Restructuring in Japan. American Economic Review 98: 1943-77.
- Calligari, Sara, Massimo Del Gatto, Fadi Hassan, Gianmarco I.P. Ottaviano, and Fabio Schivardi(2016). Italy's Productivity Conundrum: A Study on resource Misallocation in Italy. European Commission Discussion Paper 030. Brussels.
- Cinera, Michele and Olivia Galgau (2005). Impact of Market Entry and Exit on EU Productivity and Growth Performance. European Commission Economic Papers No. 222. Brussels.
- Claessens, Stijn, and Neeltje van Horen (2014). The Impact of the Global Financial Crises on Bank Globalization. IMF Working Paper. 14/197. Washington DC.
- Cycon, Lisa, Michael Koetter, and Barbara Meller (2016). Tracking the Real Effects of Monetary Policy: Evidence from European Central Bank's SMP Purchases. Frankfurt School of Finance & Management, Halle Institute for Economic Research and European Central Bank.
- Döttling, Robin, German Gutierrez, and Thomas Phillipon (2017). Is there an investment gap in advanced economies? If so, why? Paper presented at the ECB Forum on Central Banking. Sintra.
- European Central Bank (ECB) (2017). Report on Financial Integration in Europe. Frankfurt a.M.
- European Commission (2015). Better Regulation Guidelines. Commission Staff Working Document. Brussels.
- Fernald, John G., Robert E. Hall, James H. Stock, and Mark W. Watson (2017). The disappointing recovery of output after 2009. Brooking Papers on Economic Activity, BPEA Conference Drafts, March 23–24, 2017.
- Financial Stability Board (FSB) (2016). Implementation and Effects of the G20 Financial Regulatory Reforms, 2nd Annual Report. Basel.
- Financial Stability Board (FSB) (2017). Proposed Framework for Post-Implementation Evaluation of the Effects of the G20 Financial Regulatory Reforms, Consultation document on main elements. Basel.
- Foster, Lucia, John C. Haltiwanger, and C.J. Krizan (2001). Aggregate Productivity Growth. Lessons from Microeconomic Evidence. Hulten, Charles R., Edwin R. Dean, and Michael J. Harper (eds.). New developments in Productivity Analysis. University of Chicago Press. Chicago: 303–372.
- Giannetti, Mariassunta, and Andrei Simonov (2013). On the real effects of bank bailouts: micro evidence from Japan. American Economic Journal: Macroeconomics 5: 135-167.
- G20 (2017). G20 Leaders' Decleration. Shaping an interconnected world. https://www.g20.org/gipfeldokumente/G20-leaders-declaration.pdf.
- Jorda, Oscar, Björn Richter, Moritz Schularick, and Alan M. Taylor (2017). Bank Capital Redux: Solvency, Liquidity, and Crisis. National Bureau of Economic Research. Working Paper 23287. Cambridge MA.
- Jordà, Òscar, Moritz Schularick and Alan M. Taylor (2013). When Credit Bites Back. Journal of Money, Credit and Banking 45: 3–28.
- Lane, Philipp R., and Gian Maria Milesi-Ferretti (2017). International Financial Integration in the Aftermath of the Global Financial Crisis. IMF Working Paper No 115. Washington DC.
- Malmendier, Ulrika, and Stefan Nagel (2011). Depression Babies: Do Macroeconomic Experiences Affect Risk Taking? Quarterly Journal of Economics 126 (1): 373-416.
- McGowan, Müge Adalet, DanAndrews, Chiara Criscuolo, and Guiseppe Nicoletti (2015). The Future of Productivity. OECD. Paris.
- McGowan, Müge Adalet, Dan Andrews, and Valentine Millot. (2017). The Walking Dead?: Zombie Firms and Productivity Performance in OECD Countries. OECD Economics Department. Working Papers 1372. Paris.
- Midrigan, Virgiliu, and Daniel Yi Xu (2014). Finance and misallocation: Evidence from plant-level data. American Economic Review 104: 422-458.
- Nationaler Normenkontrollrat (NKR) (2015). Chancen für Kostenbegrenzung verbessert. Digitale Chancen tatsächlich nutzen! Jahresbericht des Nationalen Normenkontrollrates. Berlin.
- Peek, Joe, and Eric S. Rosengren. (2005). Unnatural selection: Perverse incentives and the misallocation of credit in Japan. American Economic Review 95: 1144-1166.
- Philippon, Thomas (2010). Financiers versus Engineers: Should the Financial Sector Be Taxed or Subsidized? American Economic Journal: Macroeconomics 2(3): 158-82.
- Reinhart, Carmen M., and Kenneth S. Rogoff (2014). Recovery from Financial Crises: Evi-dence from 100 Episodes. NBER Working Paper 19823. Cambridge MA.
- Reis, Ricardo (2013). The Portugese Slump and Crash and the Euro Crisis. Brookings Papers on Economic Activity 46(1): 143-210.
- Schivardi, Fabiano, Enrico Sette, and Guido Tabellini (2017). Credit Misallocation During the European Financial Crisis. Center for Economic Policy Research (CEPR), Discussion Paper 11901. London.
- Storz, Manuela, Michael Koetter, Ralph Stetzer, and Andreas Westphal (2017). Do We Want These Two to Tango? On Zombie Firms and Stressed Banks in Europe. IWH Discussion Paper, No. 13. Halle (Saale).
- This is one key finding of a recent research project of the International Banking Research Network (IBRN), which has been summarized in Buch, Bussiere, and Goldberg (2016).
- Any errors are my responsibility.See Reis (2013) for a discussion of the Portuguese case.
- The output gap measures the difference between actual output growth and its long-term potential.
- This is the result of work by Asturias, Hur, Kehoe, and Ruhl (2017) using Chilean and Korean data.
- Their sample covers the period 2004-2013 and complements earlier results by Albertazzi and Marchetti (2010), covering the crises years 2008-2009 only.
- This includes causal identification of effects of policy interventions: "Evaluation looks for evidence of causality – i.e. did the intervention bring about the expected changes or were there other unintended or unexpected changes." (European Commission 2015, p.50)