
Price trends over the product life cycle and monetary policy Research Brief | 29th edition – October 2019
Consumer goods prices systematically depend on product age. A new study analyses this dependence and shows that it plays an important role in aggre-gate inflation and the optimal inflation rate.
Consumer goods experience constant change. In modern economies, many products are replaced by slightly altered, newer versions within the space of a year. Some new products are relatively expensive to begin with, and only become cheaper as time goes by. Other products are relatively inexpensive at the beginning, but become more expensive over their lifetime. But how pronounced are these price trends?
In Adam und Weber (2019), we measure these trends in over 1,000 expenditure categories. In most categories, product prices significantly decrease over the lifetime of the products relative to the average price in the particular category. We integrate this price behaviour into a theoretical model to explore classic monetary policy questions from a new angle: how should a central bank set the optimal inflation rate in a modern economy? How high is this rate and how has it changed over the last few years?
Measuring price trends
We use almost 30 million price observations at product level collected by the UK Office for National Statistics for the general consumer price index for the period from 1996 to 2016. The products are allocated to more than 1,000 expenditure categories such as “milk semi-per 2 pints” or “flat panel TV 26” - 42”. For each category, we divide the price of a particular product by the average price of all products in the category and then calculate how this relative price changes as the age of the product increases. Because we are looking at relative prices and their changes over time, our calculations are not influenced by unobserved product characteristics such as product quality.
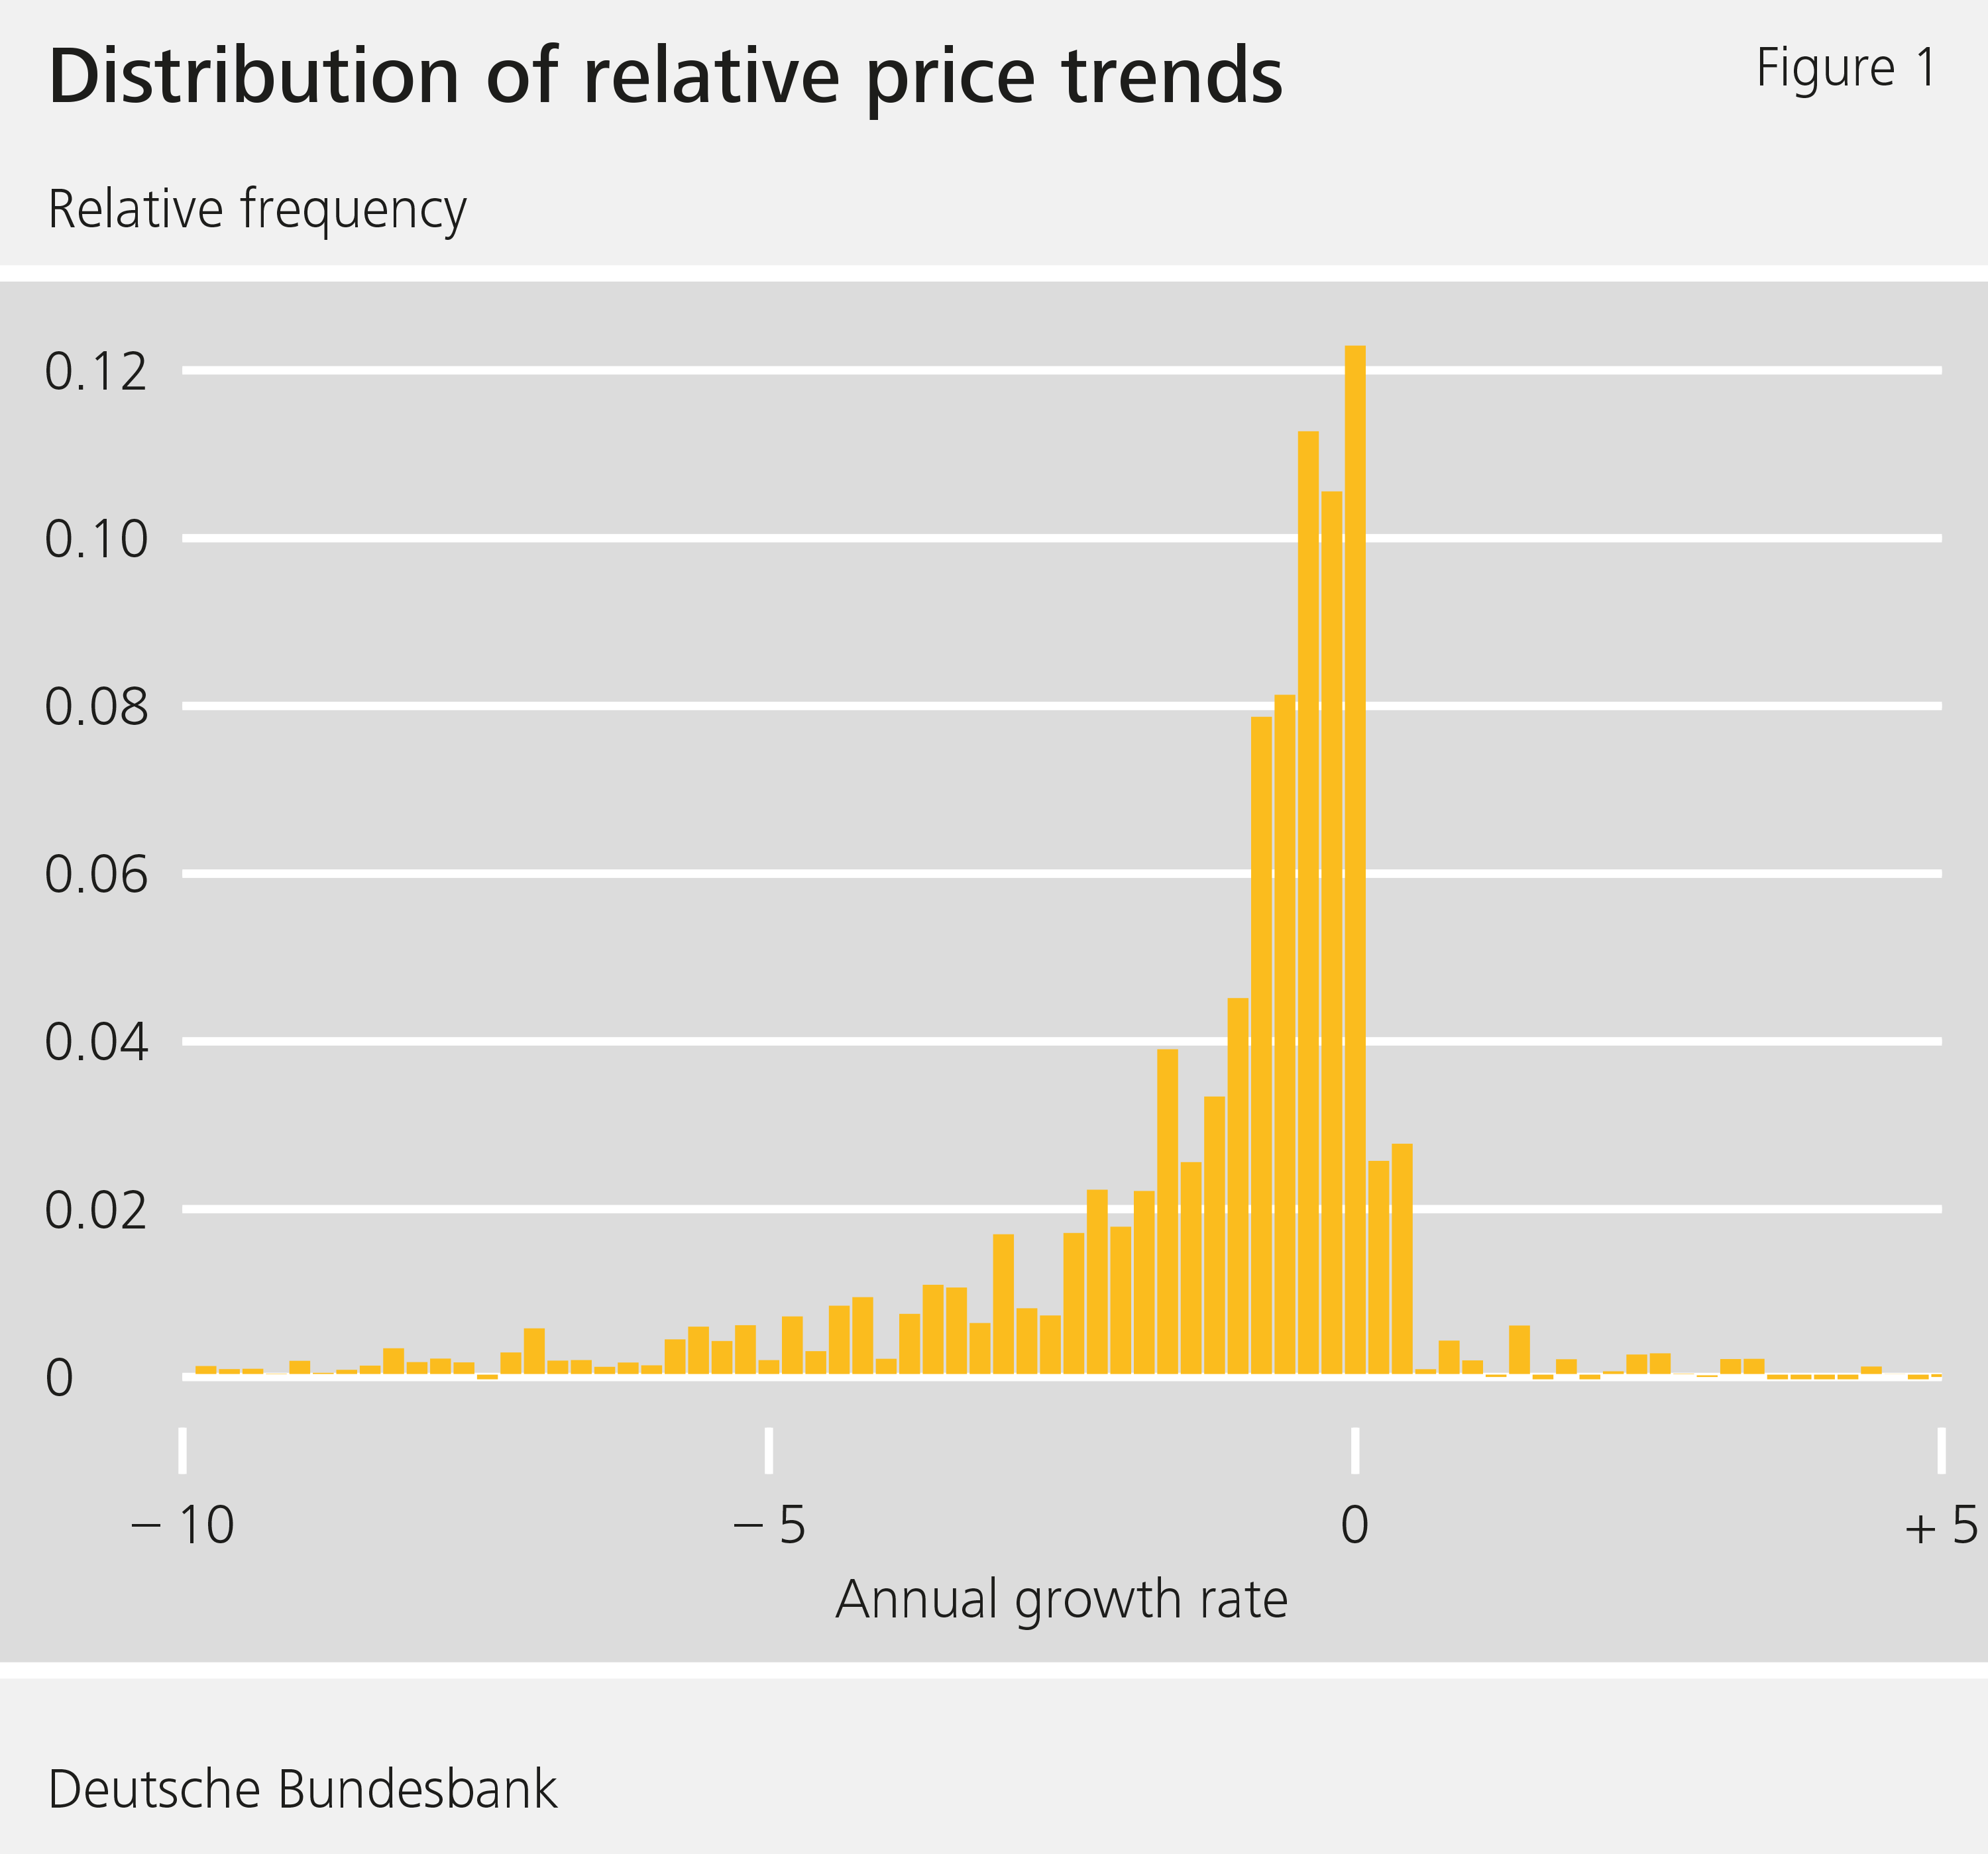
Figure 1 shows that the price trends in most expenditure categories are indeed negative. For instance, a trend of -5% shows that the relative prices fall by 5% per year on average. However, Figure 1 also points to large differences between the expenditure categories. These differences are still evident once the expenditure categories are grouped together. The decline in prices for clothing and footwear (around 280 categories), i.e. for consumer goods with a high news value, is exceptionally strong at over 9% per year. The price decline for food and non-alcoholic beverages (around 150 categories), including skimmed milk, is significantly smaller at 1% per year. By contrast, categories with positive relative price trends are very rare.
Price trends and their relevance to monetary policy
Do these price trends have an impact on monetary policy? This depends on how the trends develop. In our theoretical model, negative price trends emerge, inter alia, when products can be manufactured more efficiently over their lifetime as a result of experience accumulation, for instance. This reduces manufacturing costs over the product lifetime, making the product cheaper. Conversely, positive price trends develop at the product level if new products are better than older ones. The quality-adjusted prices of the new products are then comparatively low, meaning that the relative prices of the old products may increase over time. Our theory therefore views empirical price trends as the net effect of the two opposing fundamental forces of manufacturing efficiency and product quality.
One could argue that these forces do not translate directly into the relative price because enterprises are often slow to adjust their nominal prices in order to cut the cost of price adjustment. In our model, we show that this is of secondary importance, however, because the fundamental forces are much more important to enterprises’ profits than price adjustment costs. Enterprises prefer to pay these costs and then have a product price that reflects their current manufacturing efficiency. On aggregate, however, price adjustment costs naturally generate losses.
Monetary policy can reduce price adjustment costs
Monetary policy can influence how large these losses are: price adjustment costs do not arise if nominal product prices remain unchanged. At the same time, however, relative prices should fall as products age, in order to reflect these fundamental forces. This can only work if the average price, i.e. the price level, rises. General inflation of this kind is produced if the newly replaced products are relatively expensive – changes to the price of existing products are not necessary for this.
This leads to a new issue: perceptible differences in the relative price trends are visible across the expenditure categories (Figure 1). As a result, the ideal increase in the price level also differs across categories. The central bank can only set a general inflation target for all expenditure categories, however, meaning that unavoidable price adjustment costs will arise in some categories. Based on the mechanism considered here, the central bank should therefore select its target with an eye to keeping overall price adjustment costs as low as possible. We derive a simple and practical rule for doing this: the optimal inflation target weights the price decline in one category by its share in total consumer spending.
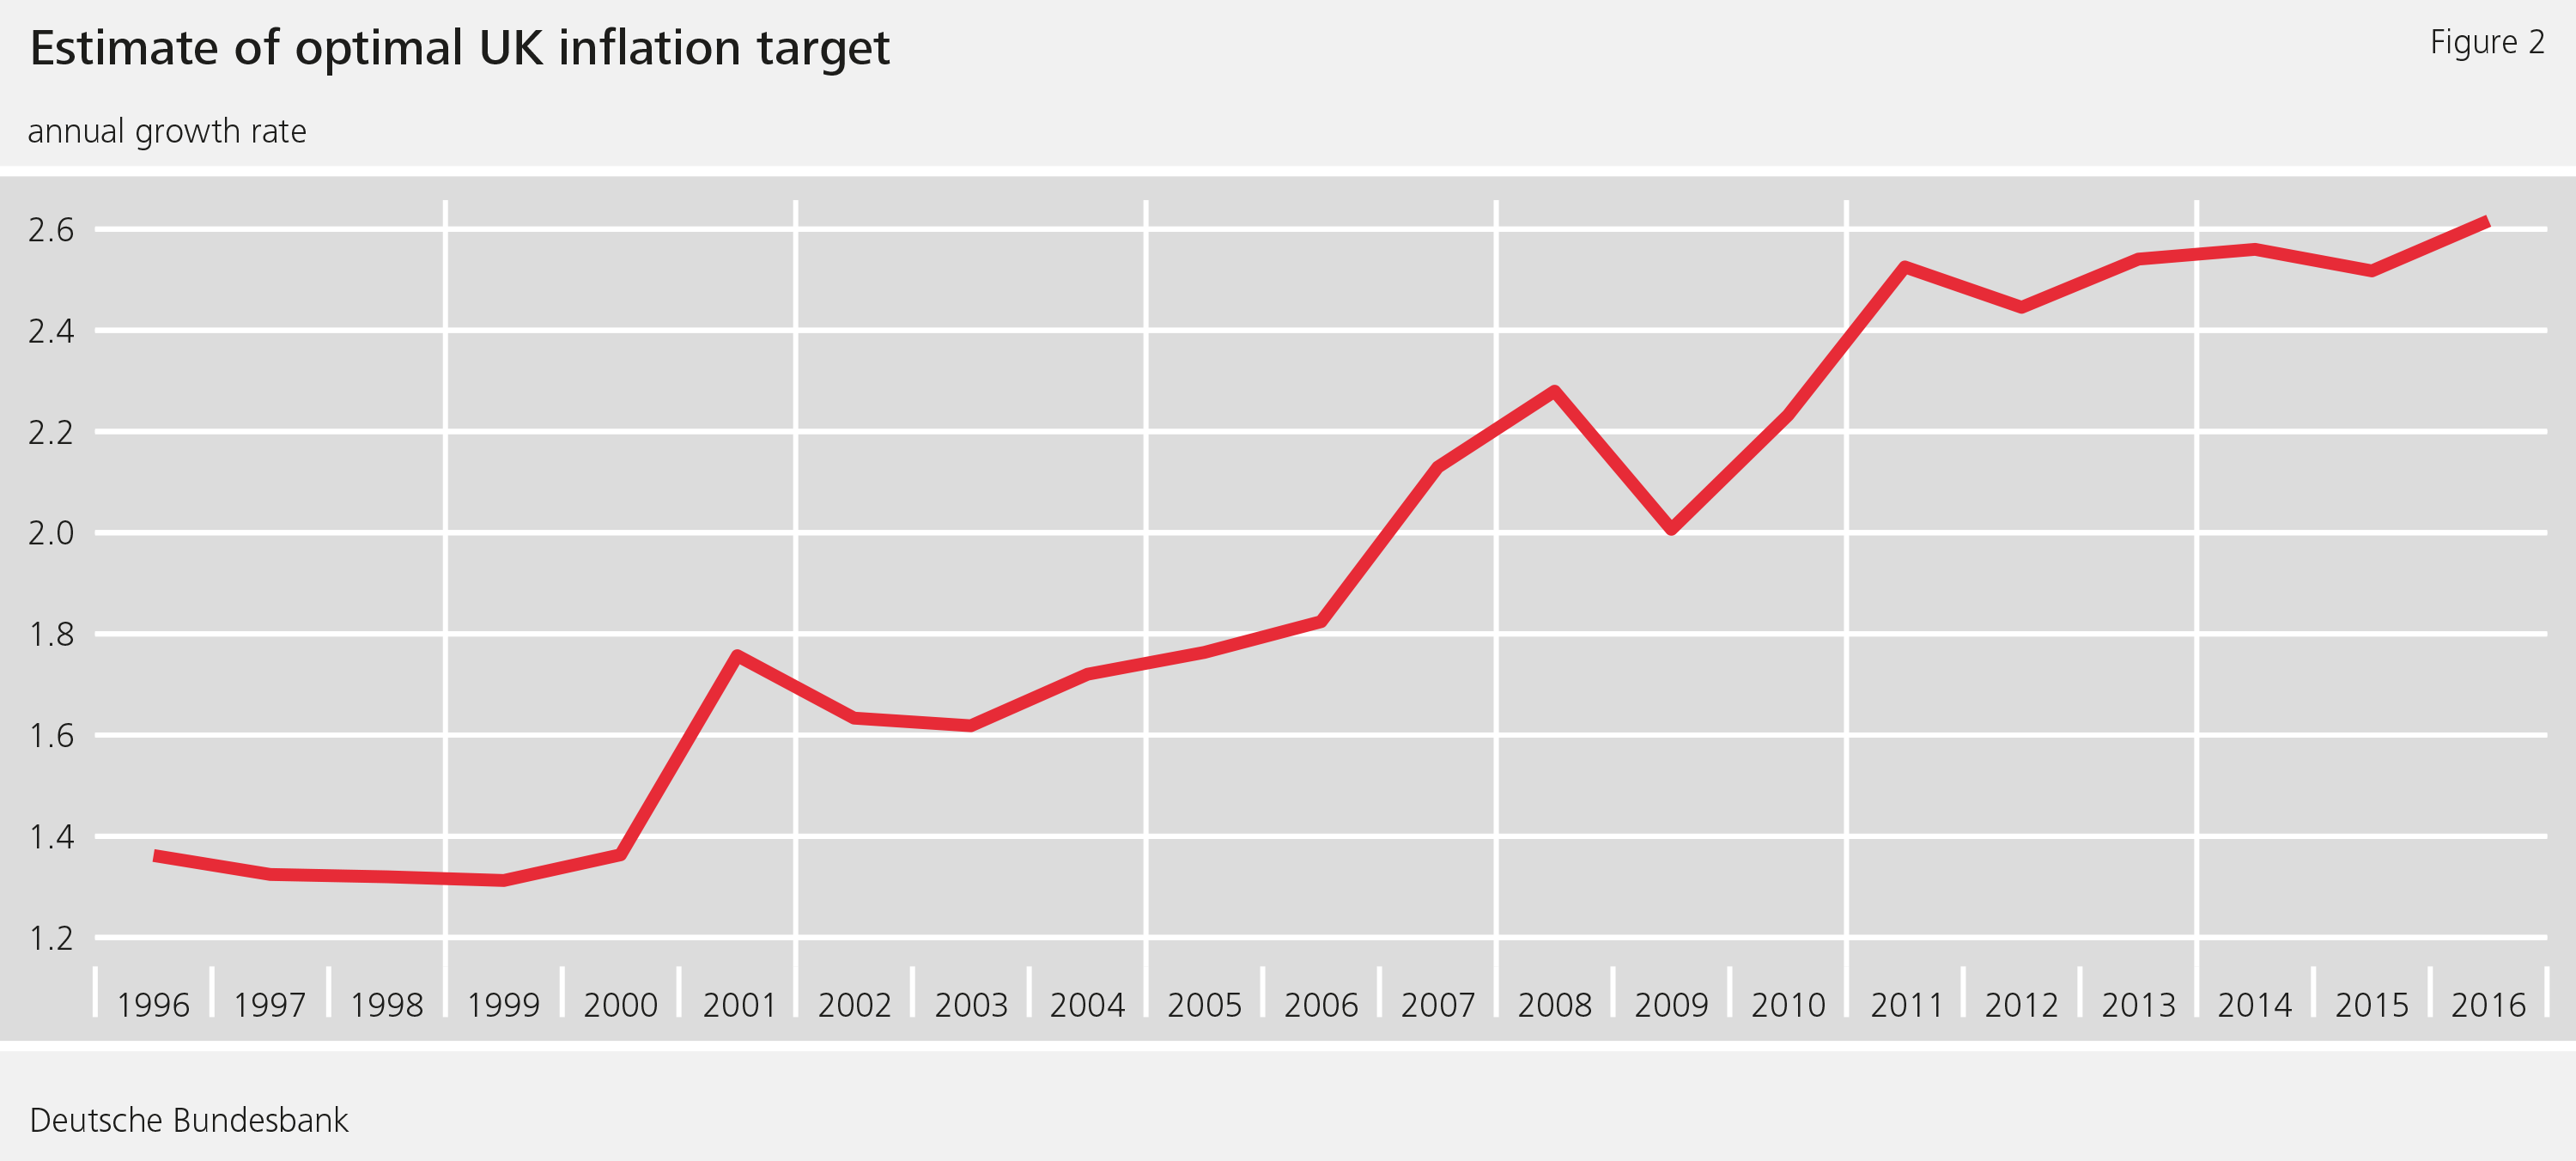
Using this simple rule and the price trends already measured, we can estimate the optimal inflation target for the United Kingdom. Figure 2 shows that our estimate is 2.6% in 2016, which is not far off the Bank of England’s actual target value, which is currently 2%. While we only measure the effect of price trends over the product life cycle, the Bank of England is – quite rightly – bound to have factored other aspects which we have not considered into its current inflation target. Figure 2 also shows that the estimated target has risen by around 1.2% over the last 20 years. This is mainly because expenditure categories showing a stronger price decline at the product level compared to the existing expenditure categories were newly incorporated into the British consumer price index during this period.
Conclusion
Consumer goods prices change considerably over the product lifecycle. These price dynamics have a bearing on the optimal inflation rate. Of course, enterprises set their prices depending on their competitors. It remains to be seen if and to what extent increasing competition – through internet trade, for instance – will change price dynamics at the product level. However, it is already clear that, in future, too, analysing micro price data will provide useful insights as to macroeconomic price developments and therefore also for monetary policy.
Disclaimer |
| The views expressed here do not necessarily reflect the opinion of the Deutsche Bundesbank or the Eurosystem. |
Literature
Adam, Klaus, und Weber, Henning, 2019: „Price Trends over the Product Life Cycle and the Optimal Inflation Target”, Bundesbank Discussion Paper No 32/2019.


News from the Research Centre
Publications
- “Time-varying return correlation, news shocks, and business cycles“ by Norbert Metiu (Deutsche Bundesbank) and Esteban Prieto Fernandez (Deutsche Bundesbank) will be published in the European Economic Review.
- “The Hockey Stick Phillips Curve and the Effective Lower Bound” by Philipp Lieberknecht (Deutsche Bundesbank) and Gregor Boehl (Universität Bonn) will be published in the Journal of Economic Dynamics and Control.
Events
- Spring Conference on Expectations of Households and Firms
24. – 25.04.2025 | Eltville am Rhein