
How household scanner data help improve inflation forecasting Research Brief | 63rd edition – January 2024
Forecasting current month inflation (“nowcasting”) is a highly important exercise for central banks and market participants, especially in turbulent times. In a new study, researchers investigate how millions of granular weekly scanner data from households combined with machine learning (ML) techniques can improve the nowcast of monthly German inflation.
The recent major economic shocks induced by the COVID-19 pandemic and the Russian invasion of Ukraine in February 2022 increased demand for reliable real-time information about the state of the economy and consumer prices. Since official macroeconomic statistics are typically only available with a time lag and at monthly or less frequent intervals, non-traditional, higher-frequency data such as web scraping and transaction data can provide added value (see, for example, Deutsche Bundesbank, 2023). In our study (Beck, Carstensen, Menz, Schnorrenberger and Wieland, 2023), we show that weekly household scanner data in combination with machine learning (ML) techniques provide central banks and other market participants with a promising toolkit to monitor ongoing and potentially disruptive developments in real time and to make better-informed decisions in such situations.
High correlation between price indices from household scanner data and official price indices
Our dataset is taken from the household panel maintained by the market research company GfK. The dataset contains daily purchases of what are known as fast-moving consumer goods, i.e. those that are purchased regularly and consumed quickly, for the period from 2003 to 2022. The purchases recorded are primarily food and non-durable goods such as shampoo or toothpaste, which are scanned by panel participants at home and are therefore referred to as household scanner data. On average, the GfK household panel for Germany comprises around 30,000 households, 200,000 products (measured at the barcode level) and 30 million observations per year. In addition, the dataset contains detailed product descriptions and has its own product classification system. These descriptions allow data to be mapped to the most disaggregate level used in the German consumer price statistics, i.e. according to the classification of individual consumption by purpose at the ten-digit level (COICOP-10), with items such as “butter”, “coffee beans” and “toothpaste”.
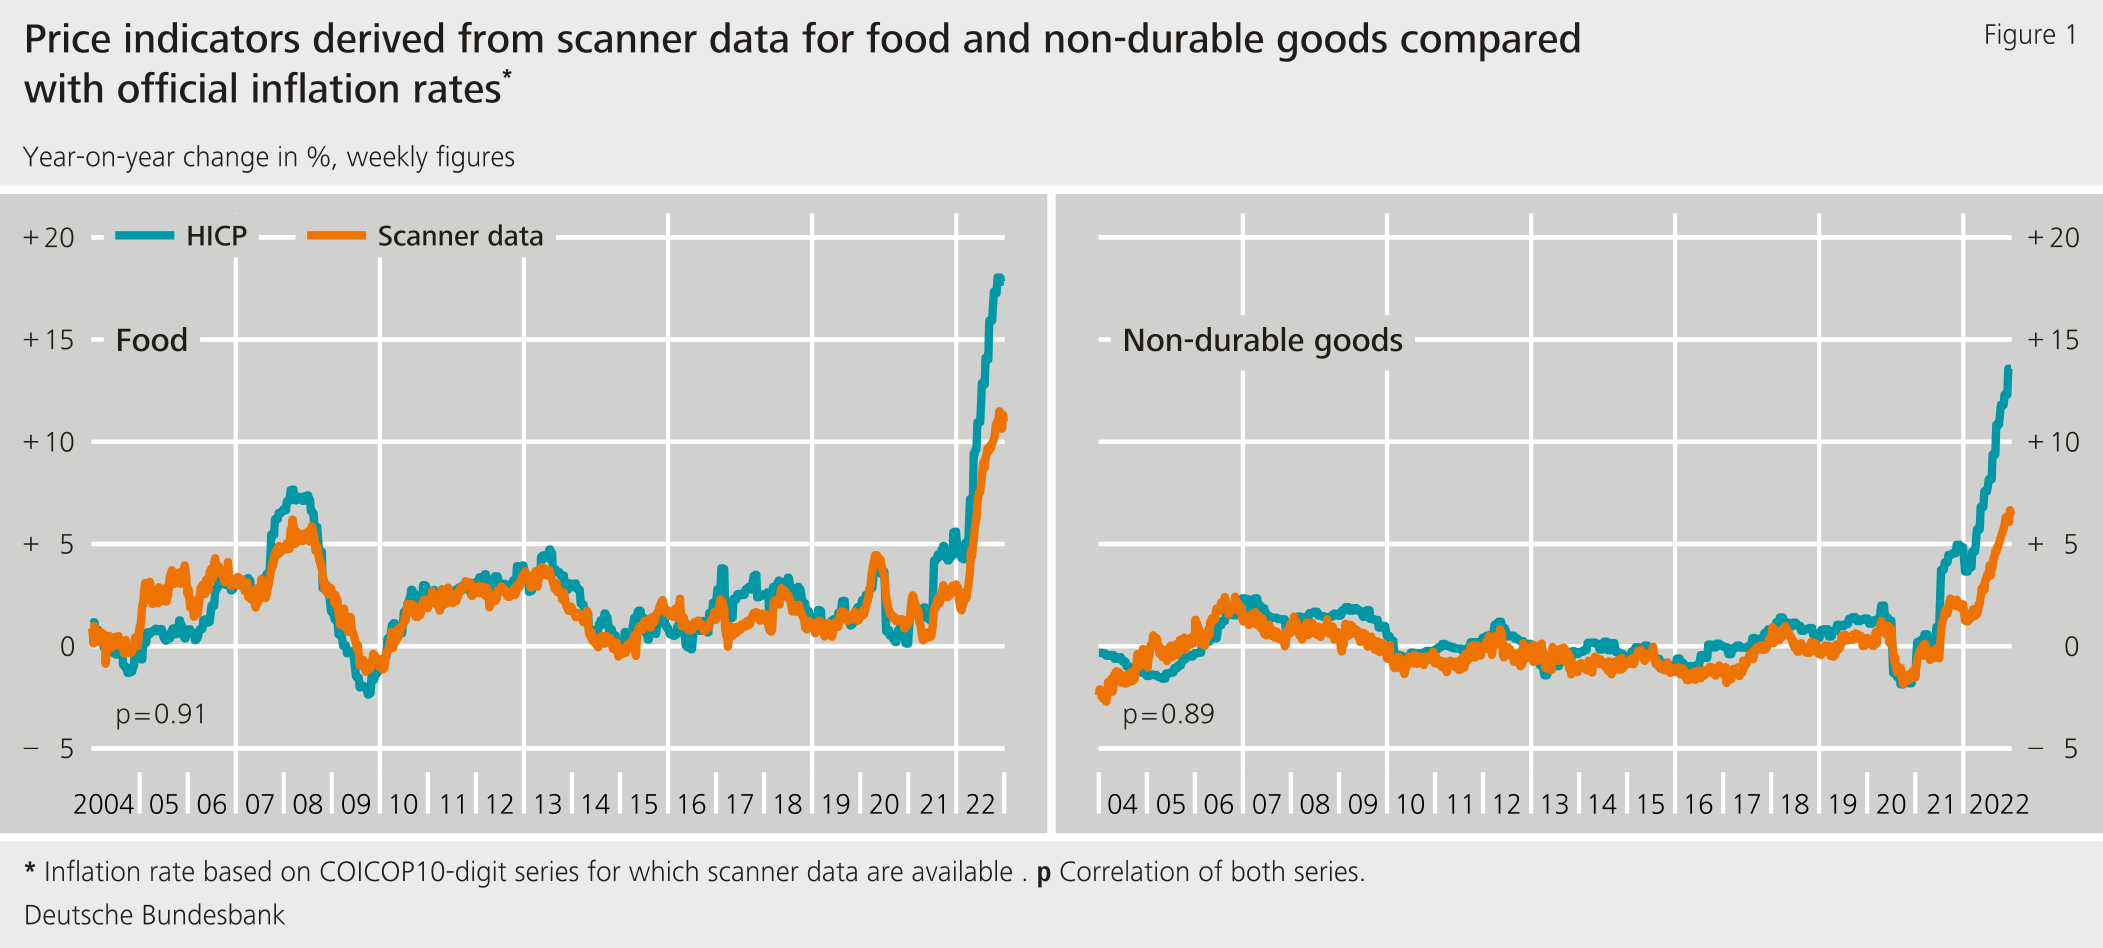
Overall, we can map the household scanner data to more than 180 product groups of the German Harmonised Index of Consumer Prices (HICP), which cover around 12% of the German basket of goods and typical outlet types such as supermarkets and discounters. From this, we derive price indices using common index methods often applied by statistical offices in connection with scanner data (specifically, time-product dummy regressions; see Eurostat, 2022). We show that our scanner data-based price indices match official price indices fairly closely (see Figure 1). Periodic differences between the indices (such as in the most recent period of high inflation) can be explained in part by the fact that, compared with the official price statistics, actual transaction data are likely to include more special offers and product substitutions.
Household scanner data improve nowcasting at various levels
First, we specify a time series model for mixed frequencies for each of the around 180 COICOP-10 items (specifically, the unrestricted mixed data sampling (U-MIDAS) model; see Foroni, Marcellino and Schumacher, 2015). Here, the weekly price indicator is used to predict the monthly inflation rate on days 7, 14, 21 and 28 of a month. We show that this approach reduces the nowcast error substantially relative to a univariate time series benchmark model. Current month inflation nowcasts already improve early in the month just with scanner data for the first seven days of a month.
In a second step, we look at the three major product groups “unprocessed food”, “processed food” and “non-energy industrial goods” (including, for example, consumer goods for the household), whose inflation rates are often the focus of monetary policy analysis. As these product groups consist of many individual COICOP-10 items, use of the above U-MIDAS model is no longer possible due to the correspondingly large number of parameters. We therefore resort to shrinkage estimators from the ML toolkit (see Babii, Ghysels and Striaukas, 2022) to efficiently integrate the large set of potential predictors into a time series model. Compared with the benchmark model, we achieve forecast error reductions of up to 25%. Again, our ML-based approach leads to nowcasting gains after just the first seven days of a month.
In the final step, we nowcast headline inflation of a given month. To this end, we consider six subcomponents of the German HICP separately: unprocessed food, processed food, energy, package holidays, non-energy industrial goods, and services (excluding package holidays). In addition to the scanner data, we expand our indicator set to include weekly price indicators for the two volatile components of energy (from the European Commission's Weekly Oil Bulletin) and package holidays (based on actual bookings via the Amadeus platforms, see Henn et al., 2019). Specifically, we estimate a mixed-frequency ML model that directly selects the relevant predictors for each of the six components (“direct ML”) and a bottom-up U-MIDAS model for each COICOP-10 item, the nowcasts of which we aggregate first to the components and then to headline inflation using the official HICP weighting scheme.
We show that both approaches produce highly competitive nowcasting models that are on par with, or even outperform, Bloomberg market expectations (see Figure 2). Market expectations are only available for headline inflation and are typically obtained in the second half of the month. When forecasting inflation, their predictions can be considered as a benchmark that is hard to beat (see Bańbura, Leiva-León and Menz, 2021). In terms of the approach chosen, it can be seen that the direct ML approach was difficult to beat in normal times, as measured by relatively low inflation volatility, but performed worse than market expectations in times of higher volatility. By contrast, the bottom-up approach improved inflation nowcasting in turbulent times, particularly with the expiry of the temporary VAT cut in January 2021 and during the sharp rise in inflation in 2022.
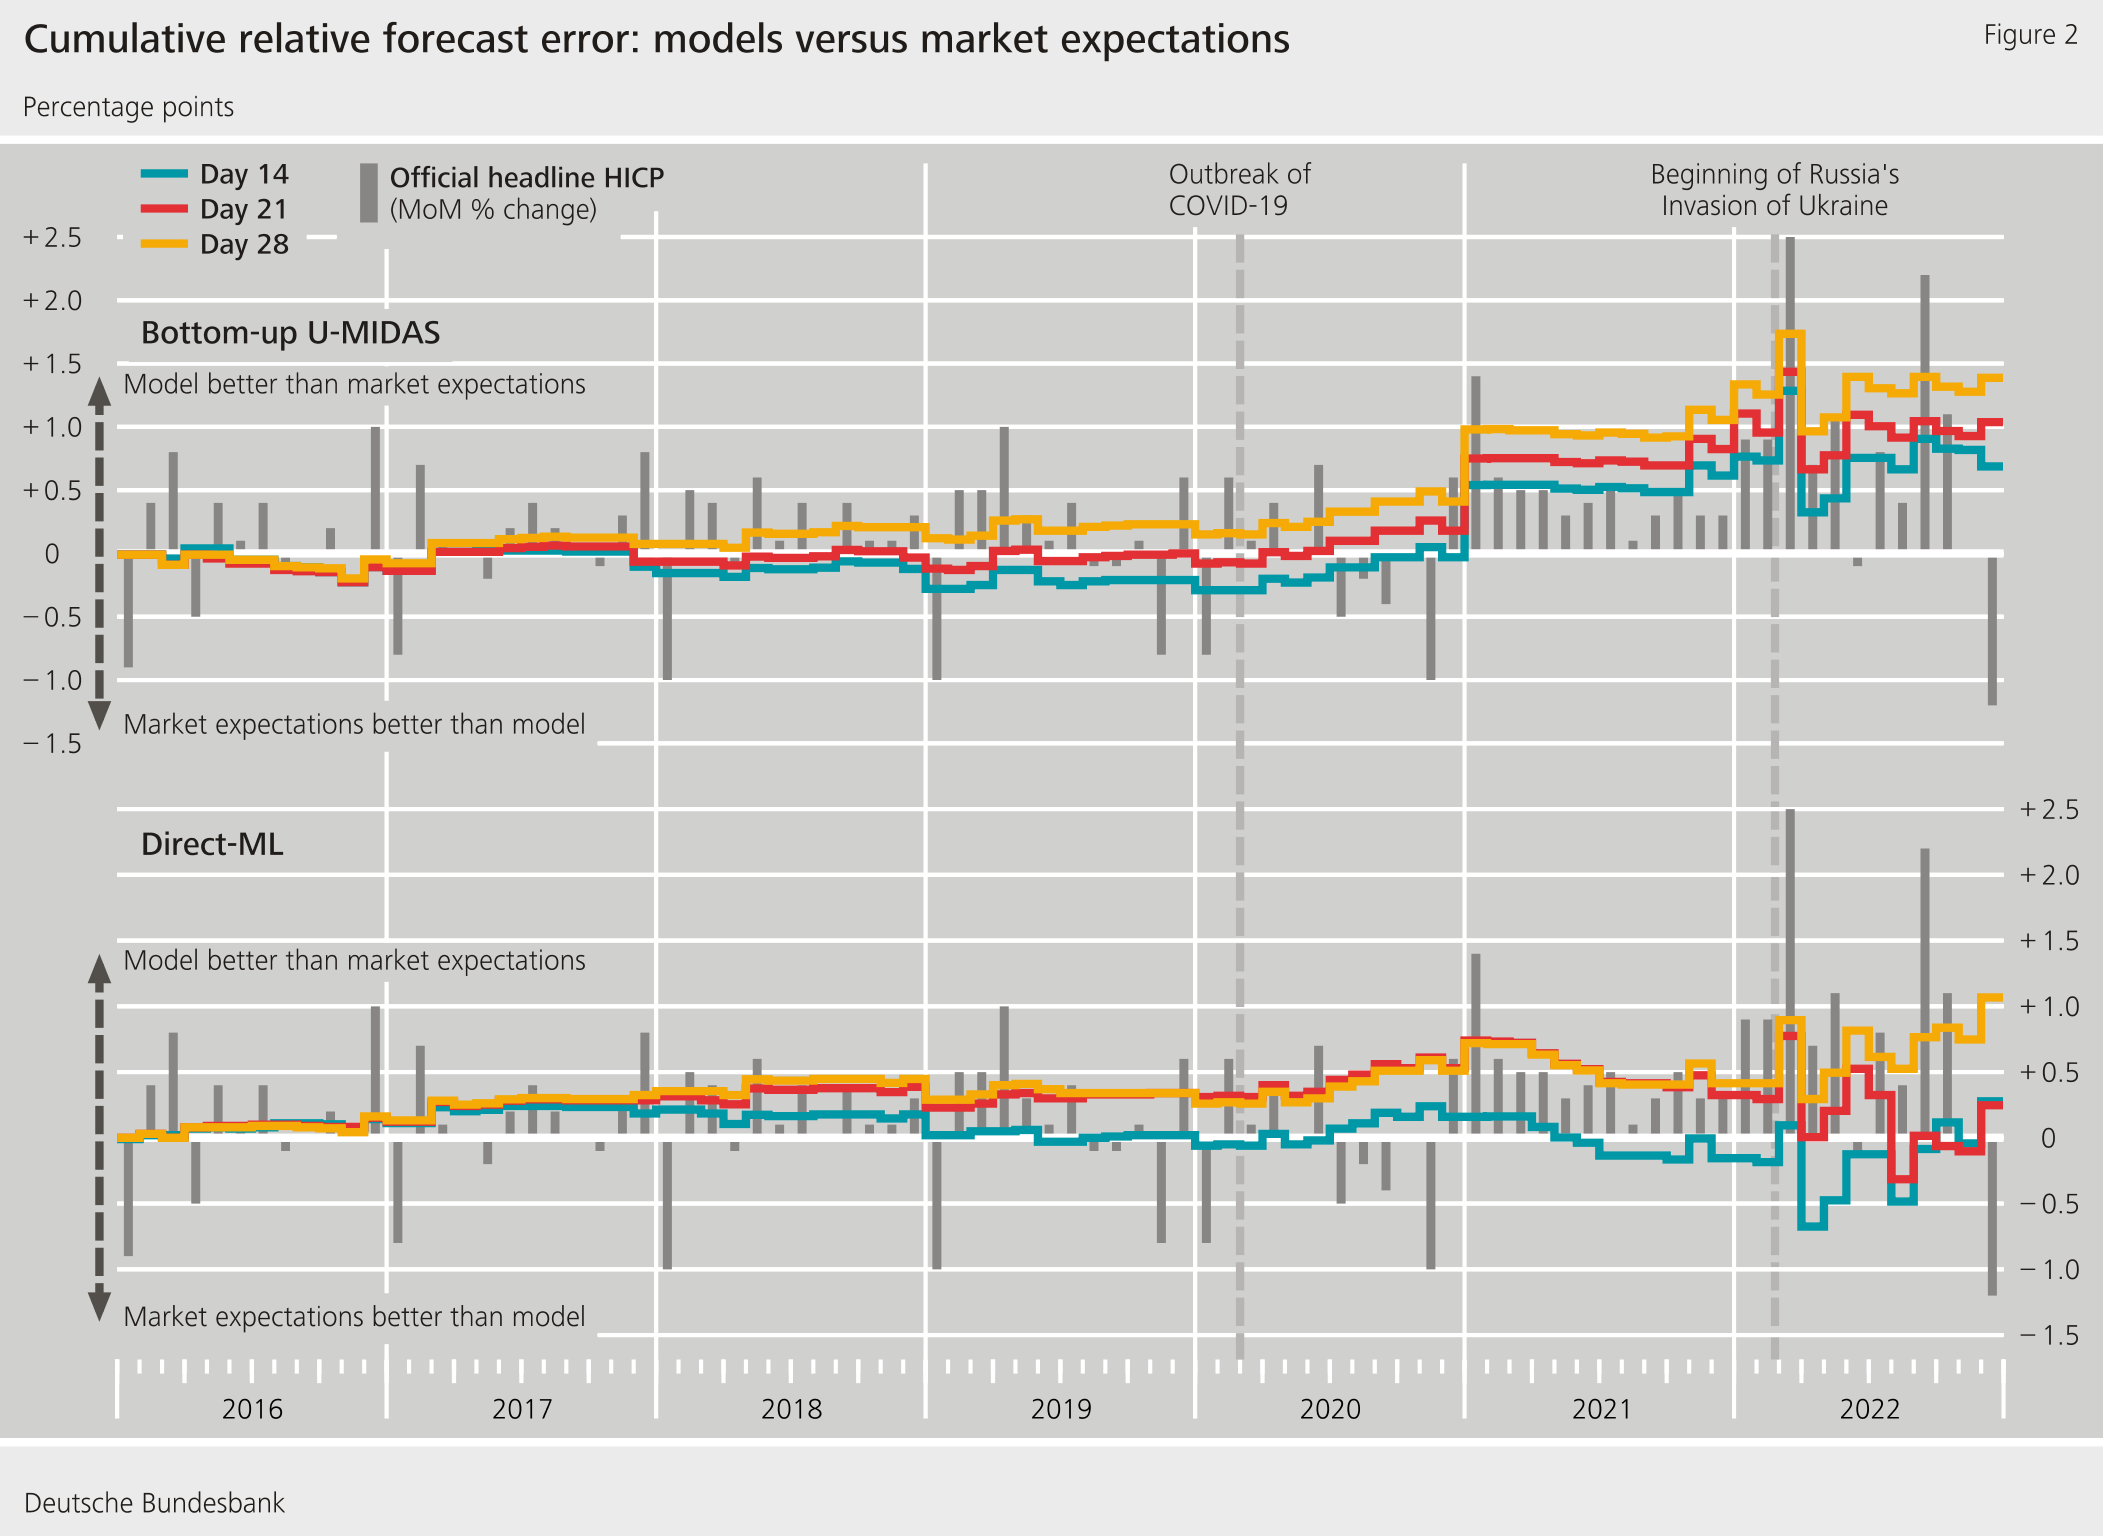
Note: The figure shows, on the left axis, the (inverted) cumulative sum of the squared forecast error differential of our model forecast (bottom-up U-MIDAS approach in the top panel and the direct ML approach in the bottom panel) compared with Bloomberg market expectations in the survey period (days 14, 21 and 28). The grey bars represent month-on-month changes in official inflation.
Sources: GfK household panel, Weekly Oil Bulletin of the European Commission, Amadeus, Bloomberg survey, own calculations.
Conclusion
Weekly price indices from household scanner data can significantly improve monthly inflation nowcasts at various levels. This is clearly evident at the level of major subcomponents of German inflation and is generally already the case after the first seven days of a month. Our nowcasting approach to headline inflation produces highly competitive models that are on par with, or even outperform, market expectations. If such data could be made available on a continuous basis in the future, their use would be a promising tool in ongoing economic analysis. In terms of the approach chosen, it can be seen that ML models are difficult to beat in normal times, but do not necessarily adapt quickly enough to large shocks. Overall, therefore, neither of the two nowcasting methods analysed consistently outperforms the other. Instead, using higher-frequency scanner data and meticulously transforming them into representative price indices appears to improve predictive power as compared to standard approaches.
| Disclaimer |
| The views expressed here do not necessarily reflect the opinion of the Deutsche Bundesbank or the Eurosystem. |
References
- Beck, G., K. Carstensen, J.-O. Menz, R. Schnorrenberger and E. Wieland (2023). Nowcasting Consumer Price Inflation Using High-Frequency Scanner Data: Evidence from Germany. Deutsche Bundesbank Discussion Paper No 34/2023.
- Babii, A., E. Ghysels and J. Striaukas (2022). Machine Learning Time Series Regressions with an Application to Nowcasting. Journal of Business & Economic Statistics, 40(3), pp. 1094-1106.
- Bańbura, M., D. Leiva-León and J.-O. Menz (2021). Do Inflation Expectations Improve Model-Based Inflation Forecasts? ECB Working Paper Series No 2604.
- Deutsche Bundesbank (2023). Models for short-term economic forecasting during the recent crises. Monthly Report, September 2023, pp. 61-78.
- Eurostat (2022). Guide on Multilateral Methods in the Harmonised Index on Consumer Prices (HICP) – 2022 edition.
- Foroni, C., M. Marcellino and C. Schumacher (2015). Unrestricted Mixed Data Sampling (MIDAS): MIDAS Regressions with Unrestricted Lag Polynomials. Journal of the Royal Statistical Society, 178(1), pp. 57-82.
- Henn, K., C.-G. Islam, P. Schwind and E. Wieland (2019). Measuring price dynamics of package holidays with transaction data. Eurona 2/2019, pp. 95-132.


News from the Research Centre
Publications
- “Time-varying return correlation, news shocks, and business cycles“ by Norbert Metiu (Deutsche Bundesbank) and Esteban Prieto Fernandez (Deutsche Bundesbank) will be published in the European Economic Review.
- “The Hockey Stick Phillips Curve and the Effective Lower Bound” by Philipp Lieberknecht (Deutsche Bundesbank) and Gregor Boehl (Universität Bonn) will be published in the Journal of Economic Dynamics and Control.
Events
- Spring Conference on Expectations of Households and Firms
24. – 25.04.2025 | Eltville am Rhein