Macroeconomic time series
The Bundesbank provides its own macroeconomic time series on various topics for display and download.
-
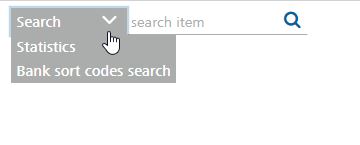
The time series are grouped in lists, which are organised in a hierarchical tree structure. You can access this directly by clicking on the menu item “Time series databases” and making a selection, eg “Macroeconomic accounting systems”.
The time series database tree allows you to search for all the available topics in the database step by step. You can open and close the individual nodes of the tree structure with a single click. Your selected path takes you directly to the available time series lists. Click on the time series of your choice in the time series list to display it as an HTML page.
-
You can view a time series by clicking on the Values, Chart, Attributes and Tables tabs and you can switch between these as required.
Values
The table of values for the time series contains data on time, value and status for each individual observation as well as the relative or absolute period-to-period and year-on-year change where appropriate. These changes are calculated from the unrounded time series values, and from hypothetical euro-based values where appropriate. The data in the "value" and "change" columns may therefore differ from one another on account of rounding.
Each time series value may have a value status describing it in more detail.
Graphs
All the values in the table of values can also be shown in a graph. You can adjust the graph by restricting the time period and selecting the (period-to-period/year-on-year) change.Click on "Update graph" to confirm your changes.
Attributes
The following time series attributes are shown:
Attributes of a time series
Attribute
Definition
Possible values
Unit
Unit in which the time series values are entered.
eg DM, euro, DM/euro, 1995=100
Unit multiplier
Factor by which the data must be multiplied in order to obtain the actual values
One, ten, hundred, thousand, ..., billion
Timespan
First and last dates entered
eg 2000-01 to 2000-12
Last update
Timestamp of last update
eg 2005-05-24 12:00:47
Further possible attributes include general comments, or comments on source, methodology or specific observations as well as information on the form of conversion used for the time series.
Tables
This page shows a list of all the tables in which the time series currently under observation appears.
-
-
DM/euro series
In national analyses, the irrevocably fixed exchange rate is often also assumed for the past in order to avoid breaks in time series. However, this procedure becomes problematic when historical data for different countries are converted into euro and then aggregated or compared with one another, since it is incorrectly assumed that the exchange rates between the national currencies were already fixed in the past. This can result in a distorted representation of the interplay between real and monetary processes within and among the economies.
Series given as DM/euro are stated in DM until December 1998 and then in euro. The rates of change in the "Year-on-year percentage change" and "Period-to-period percentage change" columns are calculated solely in euro.
Statistical breaks
The DM/euro-denominated non-seasonally adjusted series showing outstanding amounts may contain statistical breaks which are not individually noted.
Assets and liabilities of banks in Germany
Firstly, we recommend reading the methodological notes in Statistical Series „Banking statistics“.
The results for each of the most recent reporting dates are always provisional. Changes as a result of subsequent revisions, which are included in the publication for the following reporting date, are not specifically noted.
The statistics on banking business in Germany do not contain the assets and liabilities of branches of German banks abroad; however, they do include the business of branches of foreign banks in Germany.
Statistical exceptional trends are not noted in the series showing outstanding amounts. As a result of changes in the reporting sample or the survey forms/reporting methods, there were large statistical breaks in the time series at the following times:
Date
Comment
December 1959
Inclusion of credit institutions in Saarland in the reporting sample
December 1960
Inclusion of housing promotion institutions in the reporting sample
December 1985
Inclusion of small cooperative banks – which until then had not been required to report – in the reporting sample.
June 1990
Inclusion of east German credit institutions in the reporting sample
January 1995
Adjustment of banking statistics to the Federal Statistical Office's "classification of economic activities", 1993 issue (WZ 93).
January 1999
Conversion of the German banking statistics as part of harmonisation within European monetary union, involving the following changes:
Inclusion of building and loan associations' reporting data;
Treating building and loan associations as banks (previously non-banks) for the sectoral classification of counterparties of those required to report;
Changes and limitations to the time window for assets and liabilities;
Removal of assets and liabilities arising from fiduciary services from the classification of loans and deposits.External position of non-banks
(Exposures and liabilities of German enterprises vis-à-vis foreign institutions).
This primarily includes exposures and liabilities of domestic enterprises (including individuals) vis-à-vis non-residents arising from financial relationships and trade credit (credit terms and advances). It does not include participating interests in foreign enterprises, non-residents' participating interests in the equity capital of domestic enterprises or securitised assets and liabilities vis-à-vis non-residents.
Direct investment statistics
As of reporting year 2013 the foreign direct investment stocks are shown backdated to the year 2010 based on new internationally harmonized calculation requirements of the OECD Benchmark Definition, 4th edition.
The results for each of the most recent reporting dates are always provisional. Changes as a result of subsequent revisions are not specifically noted.
Selected seasonally adjusted business statistics
Seasonally adjusted figures are calculated using estimation methods and are subject to a degree of uncertainty. This means that minor changes from one period to the next in the last place of the displayed figures are also not necessarily indicative of economically induced changes. The series are usually reproduced with a degree of accuracy which allows the mainly rounded rates of change stated in the Bundesbank's analyses to be verified.
-
-
-
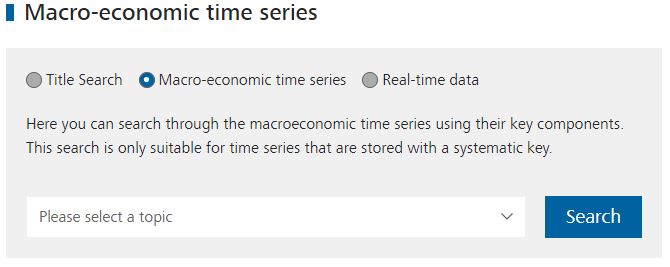
The components of the selected DSI's time series key will appear at the bottom of the site.
Clicking on the „Show list“ of the key components table opens the code list view.
You can select and apply one or more codes from the list. The key component table also offers the option to enter codes manually. Click to apply the code that you have entered.
By clicking on the „Show selection” the hits will be displayed in a results list.
-
The search will produce a list of hits. From this results list, you can add individual or several time series to your data basket, download them as a CSV or SDMX-ML file or load them in the time series view.
You can adjust the number of results displayed on each page by clicking „Results per page“ on the right-hand side above the results list.