Acquisition of financial assets and external financing in Germany in the first quarter of 2025 Results of the financial accounts by sector
- Households continue to rebalance their deposits in favour of short-term types of deposits
- Real return still declining along the entire wealth distribution
- External financing of non-financial corporations rises to €56 billion
Households’ financial assets move sideways
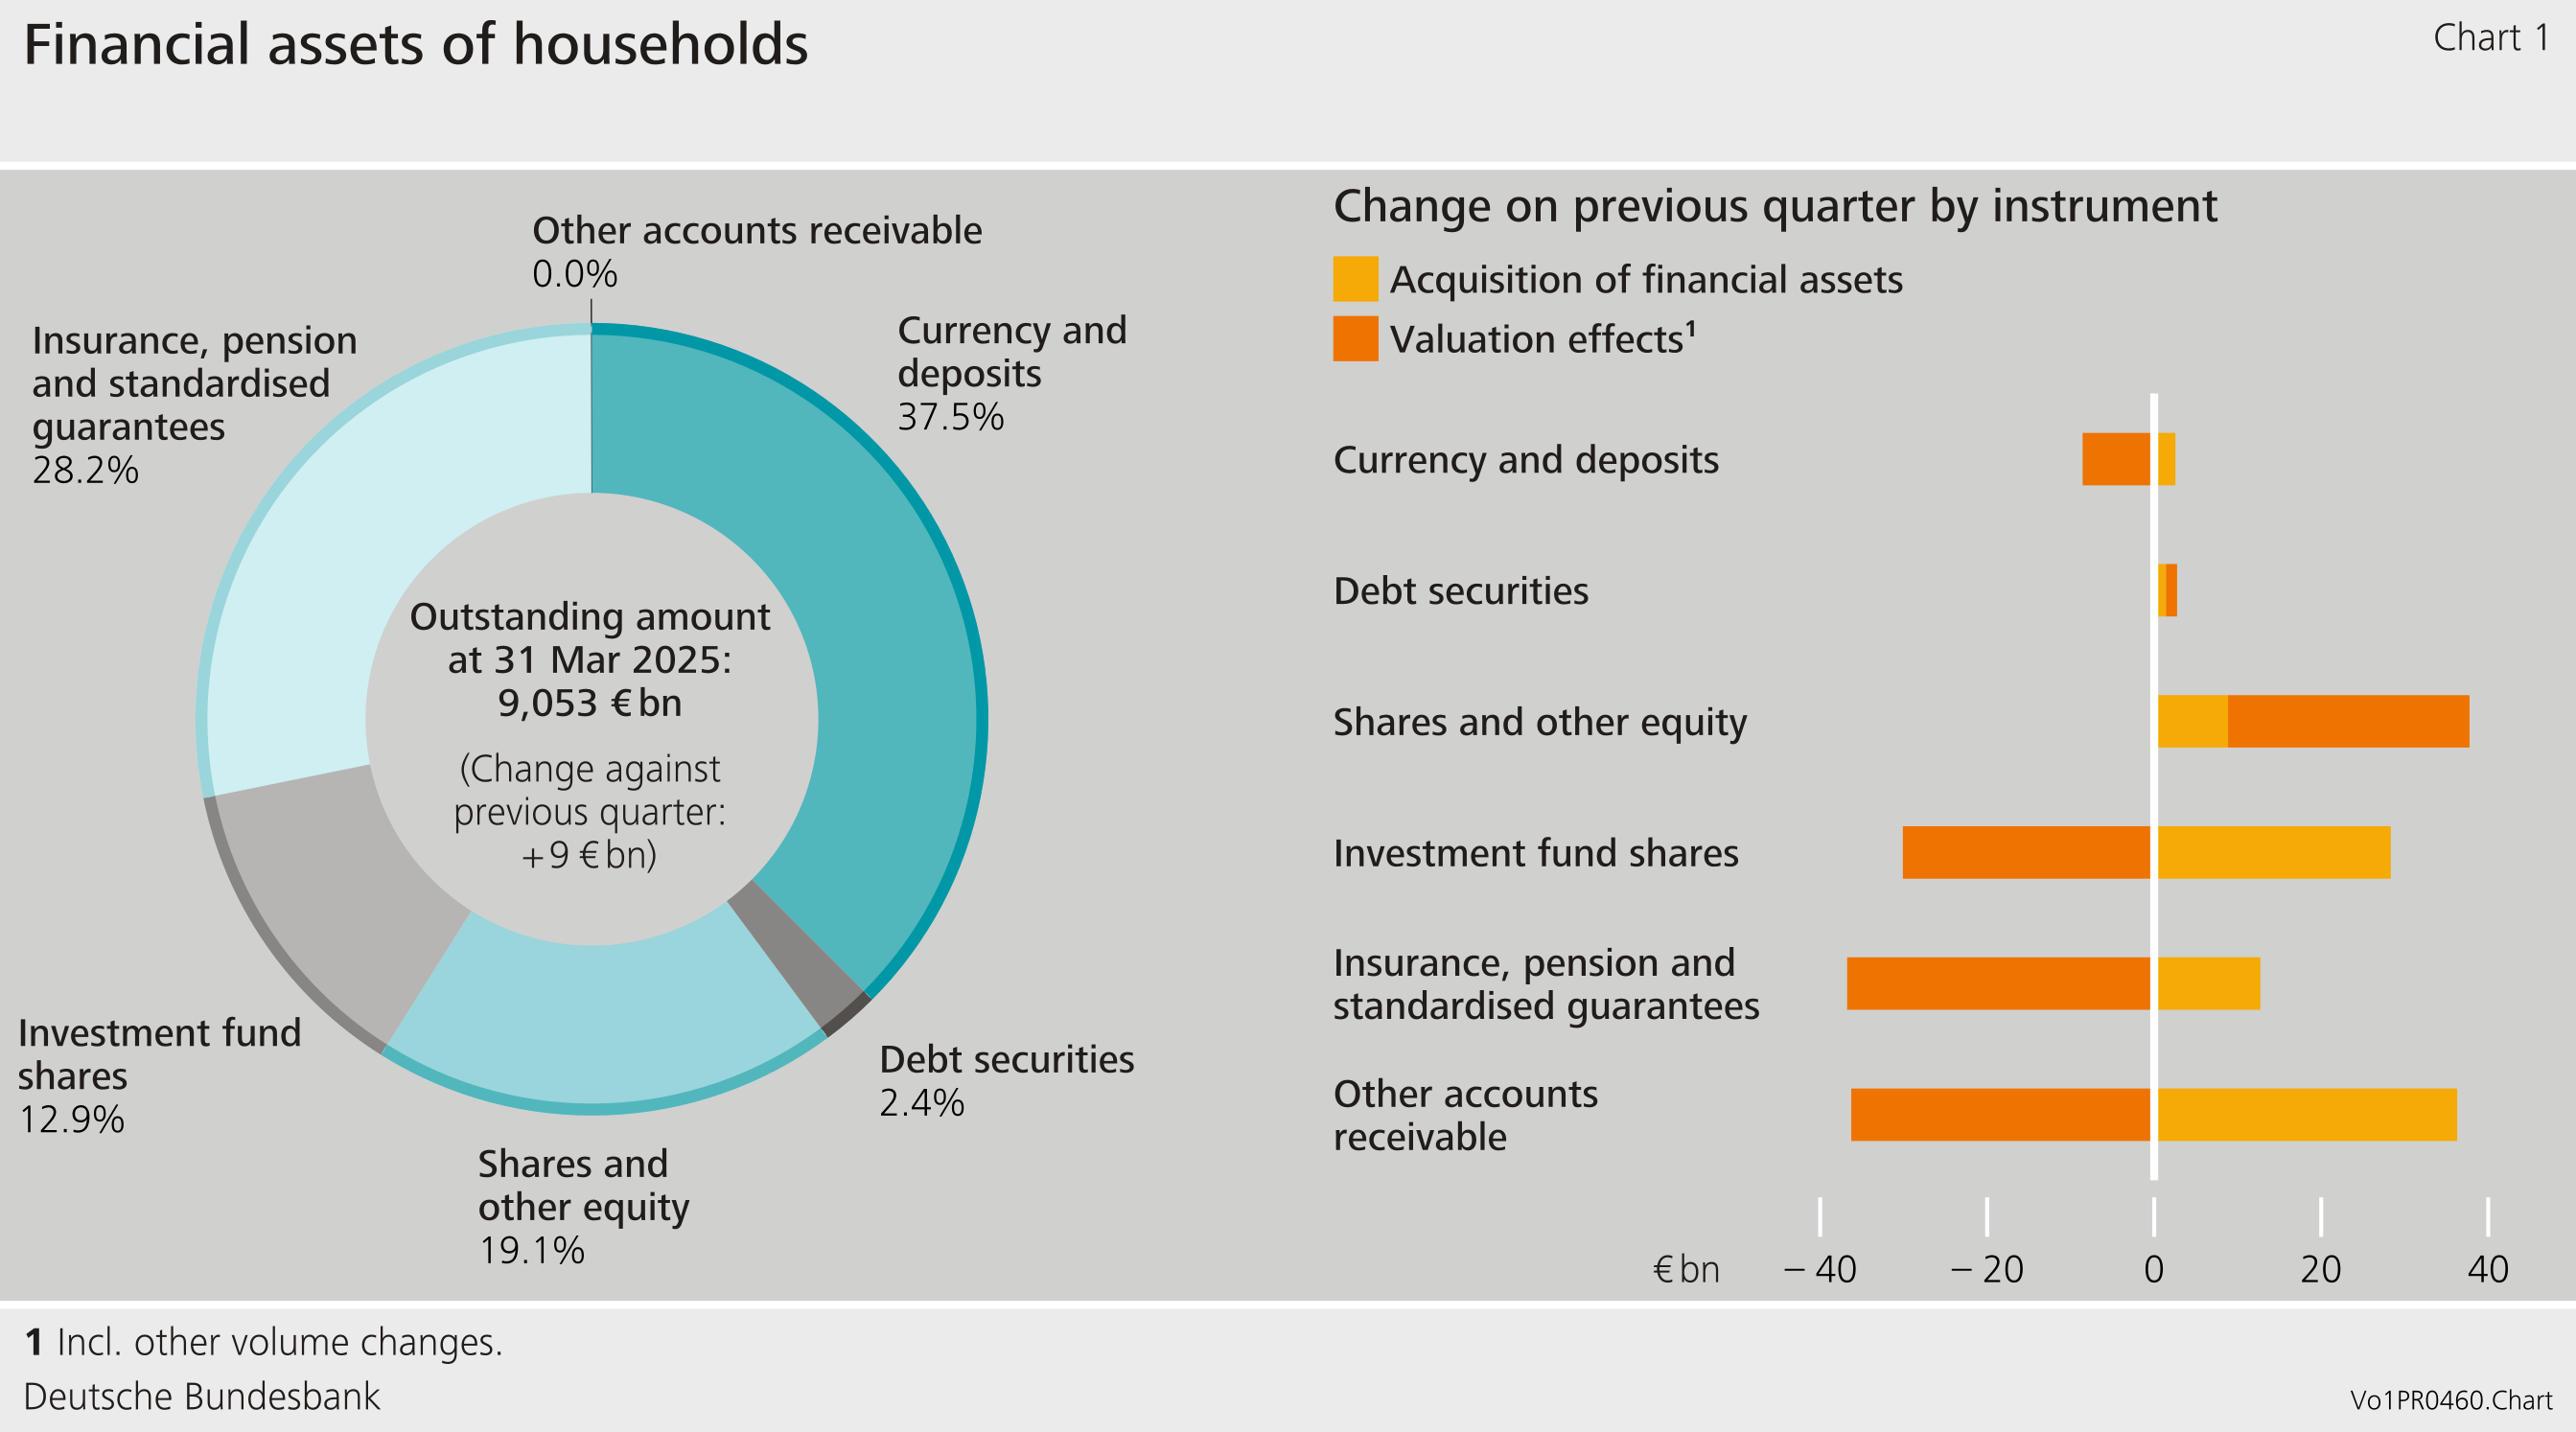
In the first quarter of 2025, German households’ financial assets grew only slightly, closing the quarter at €9,053 billion. This represents a rise of €9 billion on the previous quarter. Households increased their claims by €90 billion, but suffered valuation losses of €82 billion. At €6,913 billion, net financial assets remained virtually unchanged.
Following a strong build-up of currency and transferable deposits amounting to €65 billion in the preceding quarter, further currency and transferable deposits in the value of €17 billion were transferred during the first quarter of 2025. Savings deposits and savings bonds (by 8 billion euros), as well as time deposits (by 7 billion euros), were reduced on net terms. Households continued to shift their funds from longer-term, higher-interest deposits to highly liquid short-term deposits. The sustained preference for highly liquid short-term deposits is likely attributable to heightened economic uncertainty and falling interest rates. In line with this, the spreads between the yields on different types of deposit have narrowed as monetary policy rates have been lowered.
Debt securities were purchased in the amount of €1 billion, following a reduction of €7 billion in the previous quarter. Purchases of shares and other equity were also up again. The increase in claims on these amounted to €9 billion, €4 billion of which was attributable to listed shares from non-residents. By contrast, listed shares from domestic issuers were sold in the amount of €2 billion.
The strong increase in claims on investment fund shares seen in the previous quarter continued at a slightly weaker pace, amounting to €28 billion. Although the portion attributable to the purchase of money market fund shares fell on the quarter to €7 billion, purchase levels are still high by longer-term standards.
In the reporting quarter, there were significant differences in valuations between the individual asset classes. While households made valuation gains of €29 billion on listed shares and other equity, they suffered valuation losses of €30 billion on investment fund shares. These losses were partly attributable to exchange rate changes. Insurance and pension claims accounted for a further €37 billion in valuation losses.[1]
Real return on financial assets varies along the net wealth distribution
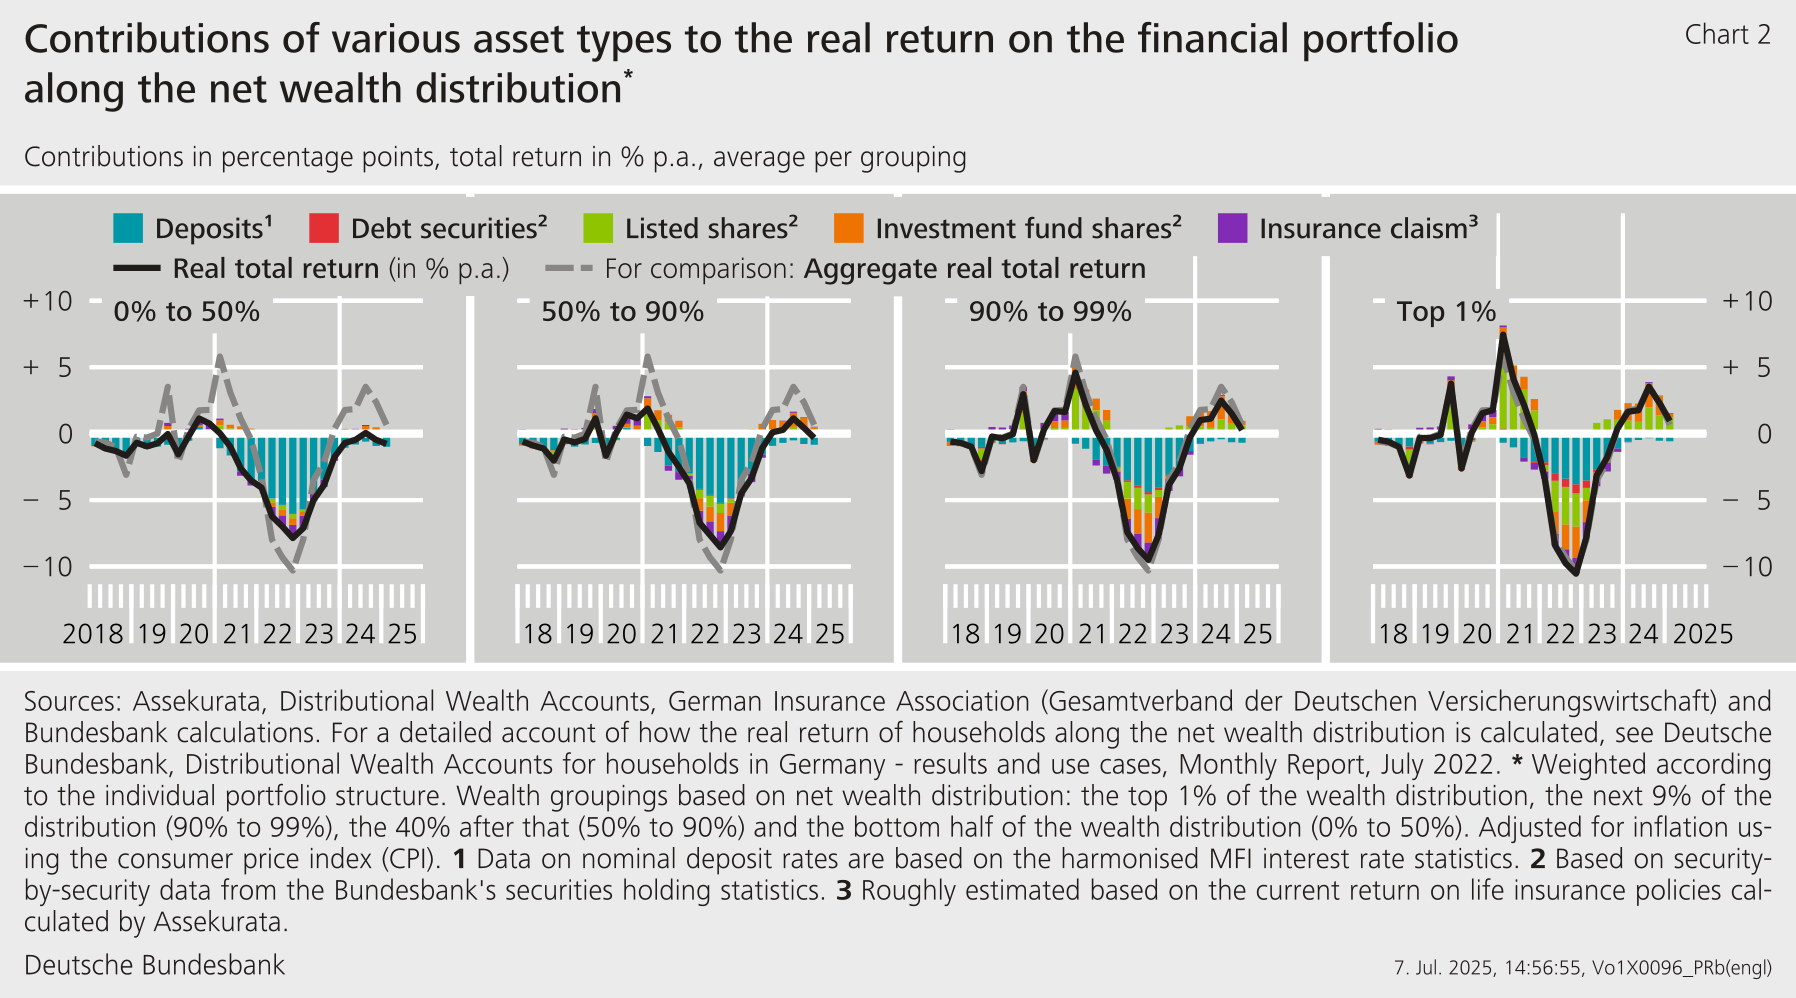
The real total return, i.e. the return adjusted for inflation, on financial assets represents the actual return on financial assets for households. With the Distributional Wealth Accounts (DWA), the Bundesbank provides additional data on the distribution of household wealth.[2] Considering the individual and period-specific structures of financial assets, Chart 2 shows the real total return on financial assets along the net wealth distribution.
An analysis of four wealth groups shows that the average possible real return across all groups declined overall in the first quarter.[3] However, positive contributions from capital market investments, particularly among the wealthiest 10 % of households, dampened this decline. This has a decisive impact on the real total return on the financial portfolio. The financial assets held by the less wealthy half of the distribution, by contrast, consist almost exclusively of low-risk investments in the form of deposits and insurance claims. As the return on these two asset types remained weak, the total return was correspondingly low and negative. Looking at all households, the aggregate real total return fell to just under 1 % in the first quarter of 2025, with only shares and investment fund shares making notable positive contributions. The negative real return on deposits continued to have a dampening effect.
Little movement in household liabilities
Households’ liabilities grew slightly in the first quarter of 2025, rising by €4 billion to a total of €2,140 billion. This small rise was mainly due to continued low borrowing totalling €5 billion. However, owing to the nominal increase in gross domestic product, the debt ratio fell by 0.2 percentage point to 49.4 %.[4]
Overall, households’ net financial assets broadly moved sideways, rising slightly by €5 billion to €6,913 billion.
External financing of non-financial corporations recovers following weak preceding quarter
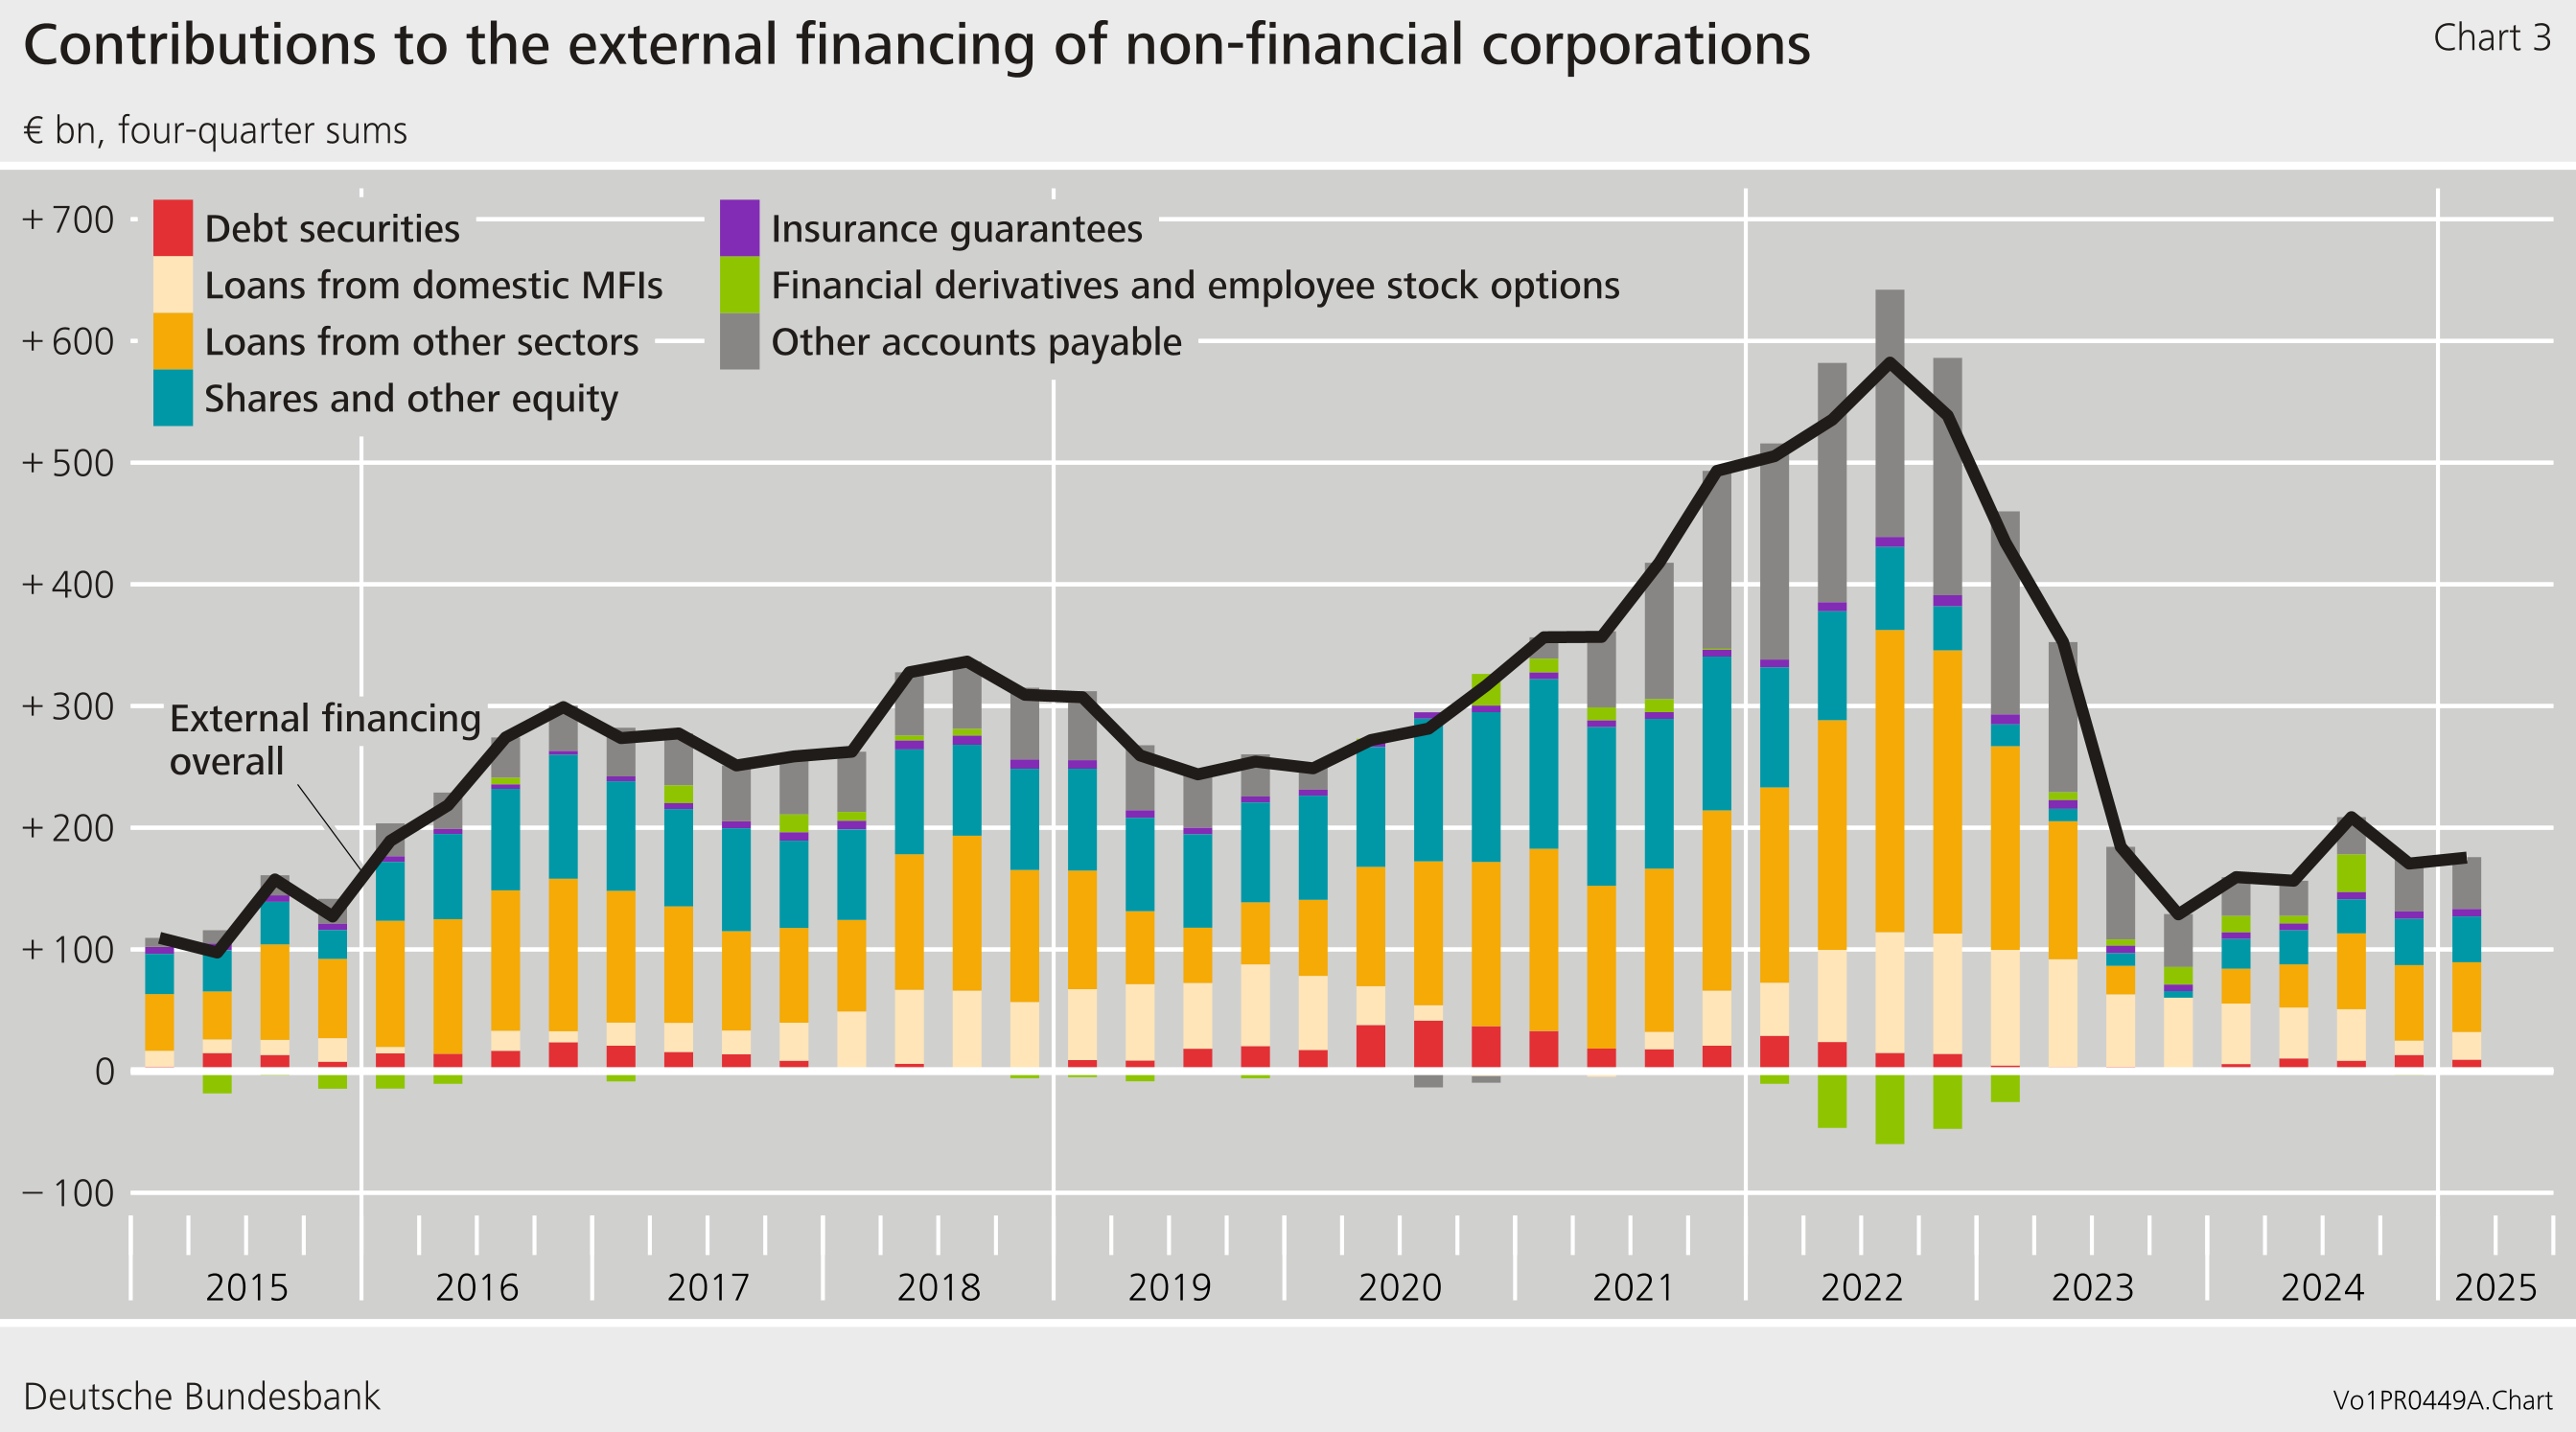
Non-financial corporations’ external financing recovered in the first quarter of 2025, going up by €35 billion to €56 billion. Borrowing rose significantly to €31 billion, compared with -€1 billion in the previous quarter. It was thus back in line with the borrowing levels seen in the quarters prior to the previous quarter.
Debt securities were issued in the amount of €3 billion. This meant that, for the first time since the second quarter of 2024, more debt securities were issued than redeemed.
Issuance of shares and other equity remained comparatively stable at €10 billion, following €7 billion in the preceding quarter.
Looking at the year as a whole, based on four-quarter moving sums, external financing increased slightly compared to the previous quarter, but continued to show little momentum.
At the end of the first quarter of 2025, non-financial corporations’ liabilities grew substantially by €183 billion to €11,780 billion. In addition to the normalisation of external financing, this was also due to valuation effects of €128 billion, which were mainly attributable to the issued equity. This resulted in a rise in the debt ratio from 67.3 % to 67.6 %.[5]
The financial assets of non-financial corporations rose by €136 billion, standing at €8,968 billion as at the end of the quarter under review. Taken together, non-financial corporations’ net financial assets dropped to -€2,812 billion.
Owing to interim data revisions of the financial accounts and national accounts, the figures contained in this press release are not directly comparable with those shown in earlier press releases.
Footnotes:
- The method for calculating households’ technical provisions is based on the Solvency II reporting regime, under which the discounted cash flow method is used to calculate/value these provisions: https://eur-lex.europa.eu/legal-content/EN/TXT/PDF/?uri=CELEX:02009L0138‑20190113. The relevant interest rate term structure for discounting technical provisions in Solvency II is determined by EIOPA on a monthly basis. At each valuation date, the provisions for all existing contracts must be valued at applicable interest rates. This form of marking to market means that, under Solvency II, technical provisions are significantly influenced by the current interest rate environment. This means valuation effects may be stronger in certain quarters.
- The DWA financial portfolio comprises the following asset types: deposits, debt securities, listed shares, investment fund shares and insurance claims (life insurance and private pension funds). For more information on the DWA, see also https://www.bundesbank.de/en/statistics/macroeconomic-accounting-systems/balance-sheets/balance-sheets-792952#tar-2
- Specifically, the net wealth distribution is divided into four wealth groupings: the top 1 % of the distribution, the next 9 % of the distribution (90 % to 99 %), the following 40 % of the distribution (50 % to 90 %), and the less wealthy half of the distribution (0 % to 50 %). Net wealth is calculated as the difference between total assets (financial portfolio plus real estate and business assets) and liabilities (loans for house purchase and other debt).
- The debt ratio represents debt as a percentage of nominal gross domestic product (four-quarter moving sum).