
Identifying Indicators of Systemic Risk Research Brief | 44th edition – December 2021
In the aftermath of the global financial crisis, a consensus rapidly emerged that systemic risk – a central concept in financial stability – needed to be contained going forward. However, to this day experts cannot agree on how to even measure systemic risk in the first place. In the past few years, researchers have proposed a plethora of indicators, making matters more difficult for policymakers. Our study proposes an analytical approach designed to lend structure to this universe of indicators for measuring systemic risk.
In 2009, the Bank for International Settlements (BIS), the Financial Stability Board (FSB) and the International Monetary Fund (IMF) defined systemic risk as a “risk of disruption to financial services that is (i) caused by an impairment of all or parts of the financial system and (ii) has the potential to have serious negative consequences for the real economy”.
Since then, a plethora of indicators designed to measure systemic risk has been put forward. In order to lend structure to the debate, in our study (Hartwig et al. (2021)) we propose a new statistical test, derived from a mapping of the official definition of systemic risk cited above into testable hypotheses. Our test allows us to provide statistical guidance on whether a proposed indicator actually measures systemic risk. This enables us to consolidate the number of candidate variables. Therefore, applying this test also broadens our understanding of systemic risk. Overall, our test provides a basis for the careful design of macroprudential policy.
Beginning with the definition of systemic risk, we argue that a variable qualifies as an indicator of systemic risk if it meets two conditions. (i) An indicator should predict a heightened probability of a disruption to financial services several quarters ahead. (ii) This probability should be positively correlated with the amount of downside risk for the real economy (e.g. lower GDP growth). Broadly speaking, an indicator is supposed to predict financial crises, which also have negative consequences for the real economy and are thus systemic within the meaning of the above definition.
Since macroprudential policies (such as the systemic risk buffer or the countercyclical capital buffer) are implemented at country level, in our study we test each indicator separately for each country. This approach allows us to establish whether an indicator also measures systemic risk consistently across all countries, i.e. whether certain values of an indicator always lead to the same policy recommendation in every country. If, for instance, for a given indicator, systemic risk is associated with a positive indicator value in one country and with a negative value in another country, that indicator is not adequate for a consistent macroprudential policy. The Basel rules are based on such a consistency requirement, amongst other things. For example, a high Basel III credit-to-GDP gap is supposed to be indicative of excessive credit growth and of the resultant cyclical vulnerability.
We apply our test to a set of indicators that are established in the literature and to 45 advanced and emerging market economies. We can identify two indicators that, by and large, are suitable for measuring systemic risk. One is the credit-boom indicator suggested by Mendoza and Terrones (2008, 2014), the other a measure of the financial cycle proposed by Schüler et al. (2020). These two indicators, just like the Basel III credit-to-GDP gap, are designed to flag excessive credit growth. They differ, however, in the calculation methodology and the choice of underlying data. The credit-boom indicator is based on real credit per capita and signals systemic risk once credit developments are in excess of regular business cycles. The financial cycle indicator incorporates not only credit growth but also asset price data and links the measurement of systemic risk to the occurrence of credit-driven asset price bubbles.
Our results lead us to conclude that, although systemic risk can be measured consistently across multiple quarters, this can only happen ex post in the best case. Ex ante measurement is only possible over a very few quarters, i.e. only when a systemic financial crisis is already “knocking at the door”.

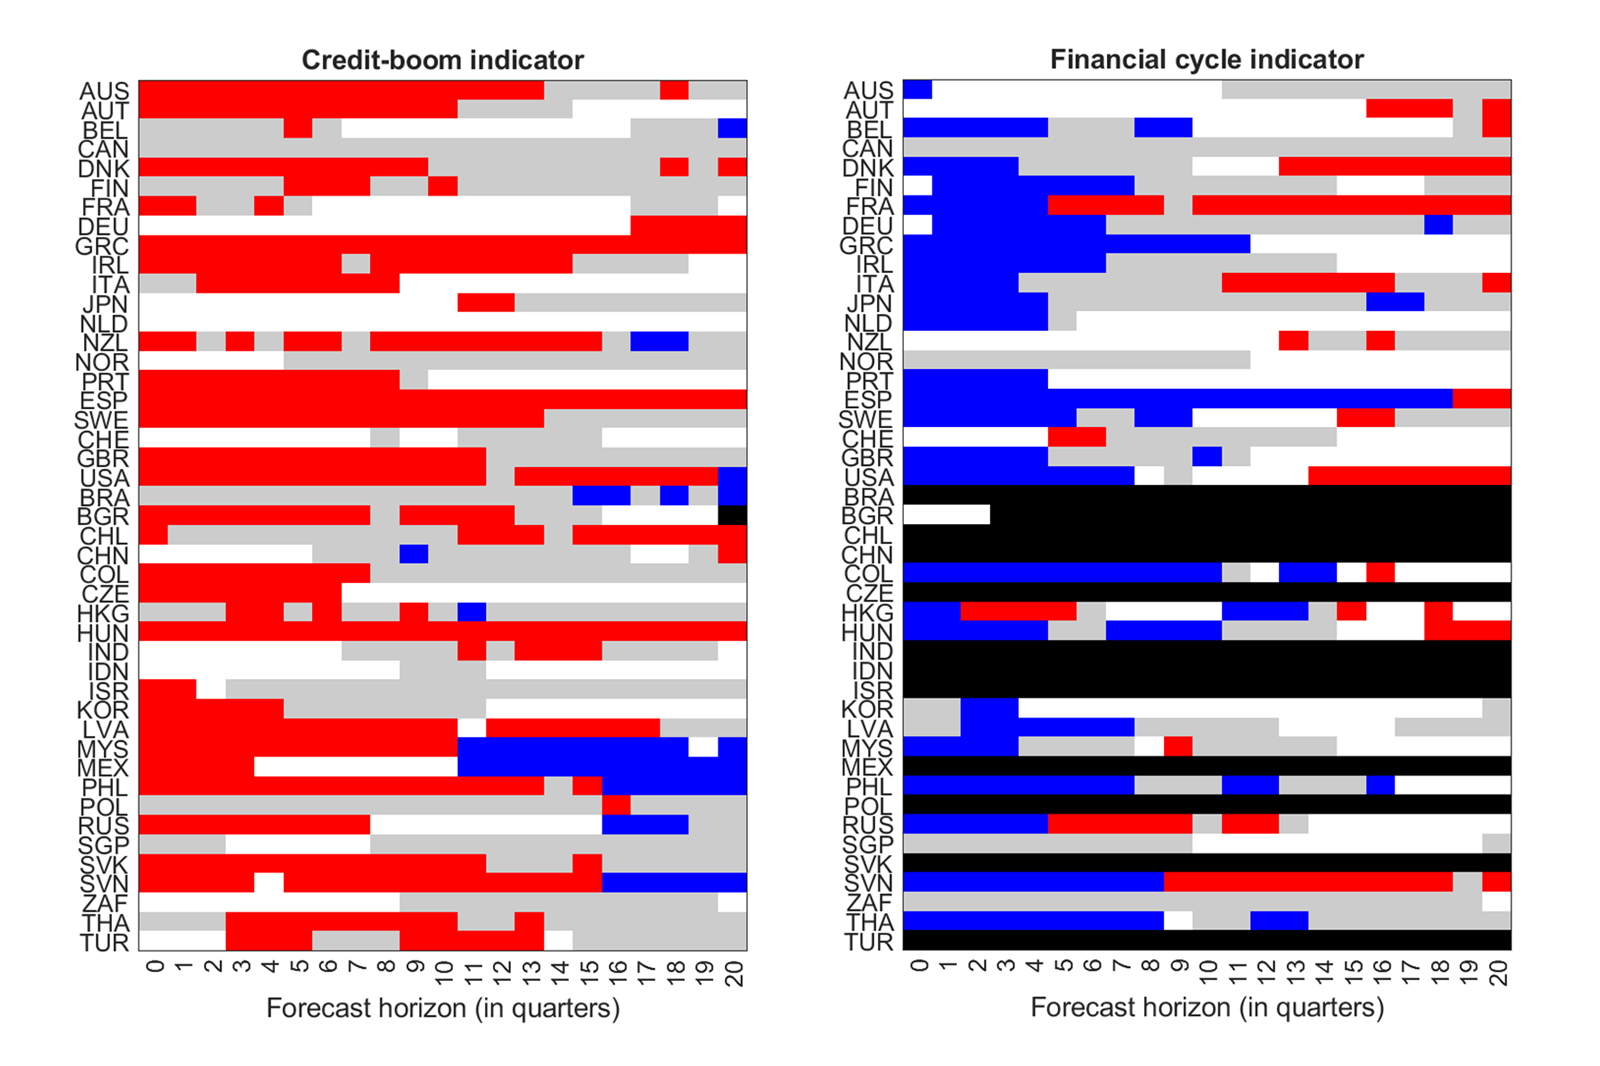
According to the left-hand panel, the indicator introduced by Mendoza and Terrones (2008, 2014) signals systemic risk for more than 80% of countries. The practical implementation of the Mendoza and Terrones indicator, however, has a drawback: for methodological reasons, it cannot be constructed in real time, i.e. it can measure systemic risk only ex post. The real-time indicator proposed by Schüler et al. (2020) and shown here in the right-hand panel does not have this drawback; it passes our test for more than 75% of countries, though only for short horizons.
Both of these indicators measure systemic risk consistently across all countries inasmuch as – at least for a very few quarters ahead – the predominant colour in a chart is either only red or only blue. For the credit-to-GDP gap and many other variables, this consistency requirement is not met. For instance, in some countries high systemic risk is associated with a high value for the credit-to-GDP gap (red), but with a low value (blue) in others.
Conclusion
Our results collectively raise considerable doubts as to whether the currently available indicators can enable us to measure systemic risk ex ante internationally and consistently across many quarters with just one indicator. We conclude that, for the time being, the synopsis of many indicators will remain a key element of macroprudential policy to safeguard financial stability.
Disclaimer |
The views expressed here do not necessarily reflect the opinion of the Deutsche Bundesbank or the Eurosystem. |
References
- Hartwig, B., Meinerding, C., Schüler, Y. (2021): Identifying indicators of systemic risk. Journal of International Economics, 132, 103512.
- Mendoza, E., Terrones, M. (2008): An anatomy of credit booms: Evidence from macro aggregates and micro data. NBER Working Paper 14049.
- Mendoza, E.G., Terrones, M.E. (2014): An anatomy of credit booms and their demise. In: Fuentes, M.D., Raddatz, C.E., Reinhart, C.M. (Eds.), Capital Mobility and Monetary Policy, Volume 18 of Central Banking, Analysis, and Economic Policies Book Series, Chapter 6. Central Bank of Chile, 165–204.
- Schüler, Y., Hiebert, P., Peltonen, T. (2020): Financial cycles: Characterisation and real-time measurement. Journal of International Money and Finance, 100, 102082.
| Authors | |
| Christoph Meinerding Research economist at the Deutsche Bundesbank’s Research Centre | Yves Schüler Research economist at the Deutsche Bundesbank’s Research Centre |


News from the Research Centre
Publications
- “Time-varying return correlation, news shocks, and business cycles“ by Norbert Metiu (Deutsche Bundesbank) and Esteban Prieto Fernandez (Deutsche Bundesbank) will be published in the European Economic Review.
- “The Hockey Stick Phillips Curve and the Effective Lower Bound” by Philipp Lieberknecht (Deutsche Bundesbank) and Gregor Boehl (Universität Bonn) will be published in the Journal of Economic Dynamics and Control.
Events
- Spring Conference on Expectations of Households and Firms
24. – 25.04.2025 | Eltville am Rhein